
Research
Pay-To-Delay For Biosimilars
Fideres outlines two methodological frameworks to estimate damages from pay-to-delay cases involving biosimilars.

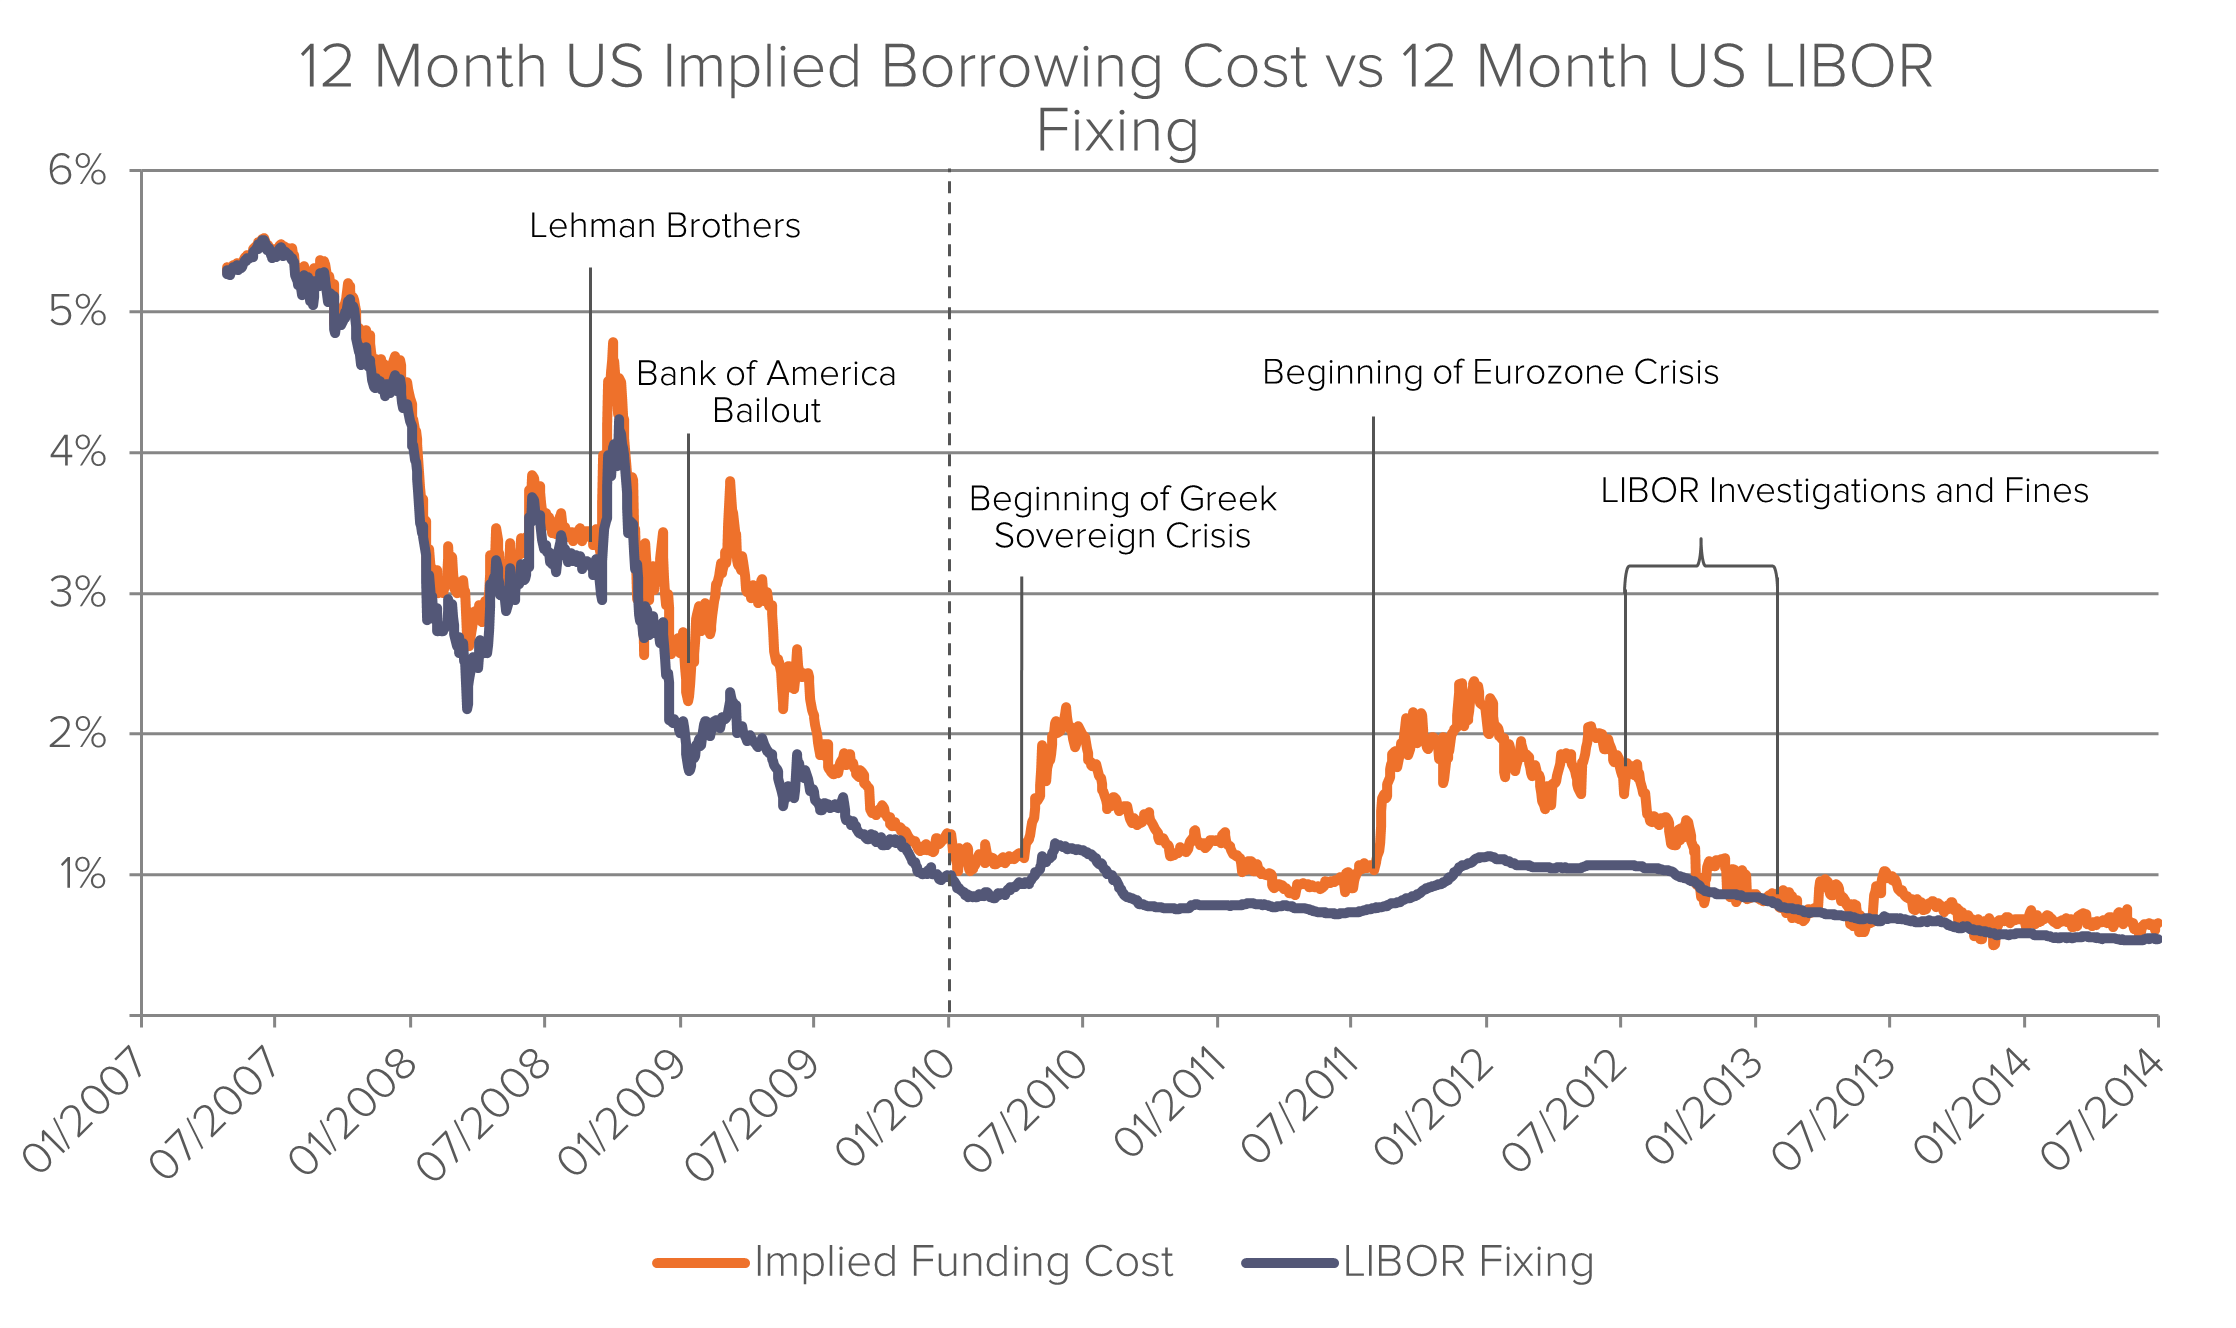
Until recently, published academic research and regulatory findings relating to LIBOR manipulation have only covered the period up to the end of 2009, mainly focusing on the time before and during the great financial crisis.
Fideres have combined and refined existing analytical approaches to determine the degree of LIBOR manipulation during 2008-2009 and subsequently have extended this analysis for the period from 2010 to date. The graph below shows the results of this analysis over the entire period. The results suggest that LIBOR manipulation may have continued to a varying degree until 2013.
 We further analysed the size of the potential LIBOR suppression during this period. A summary of the results is shown in the graph below:
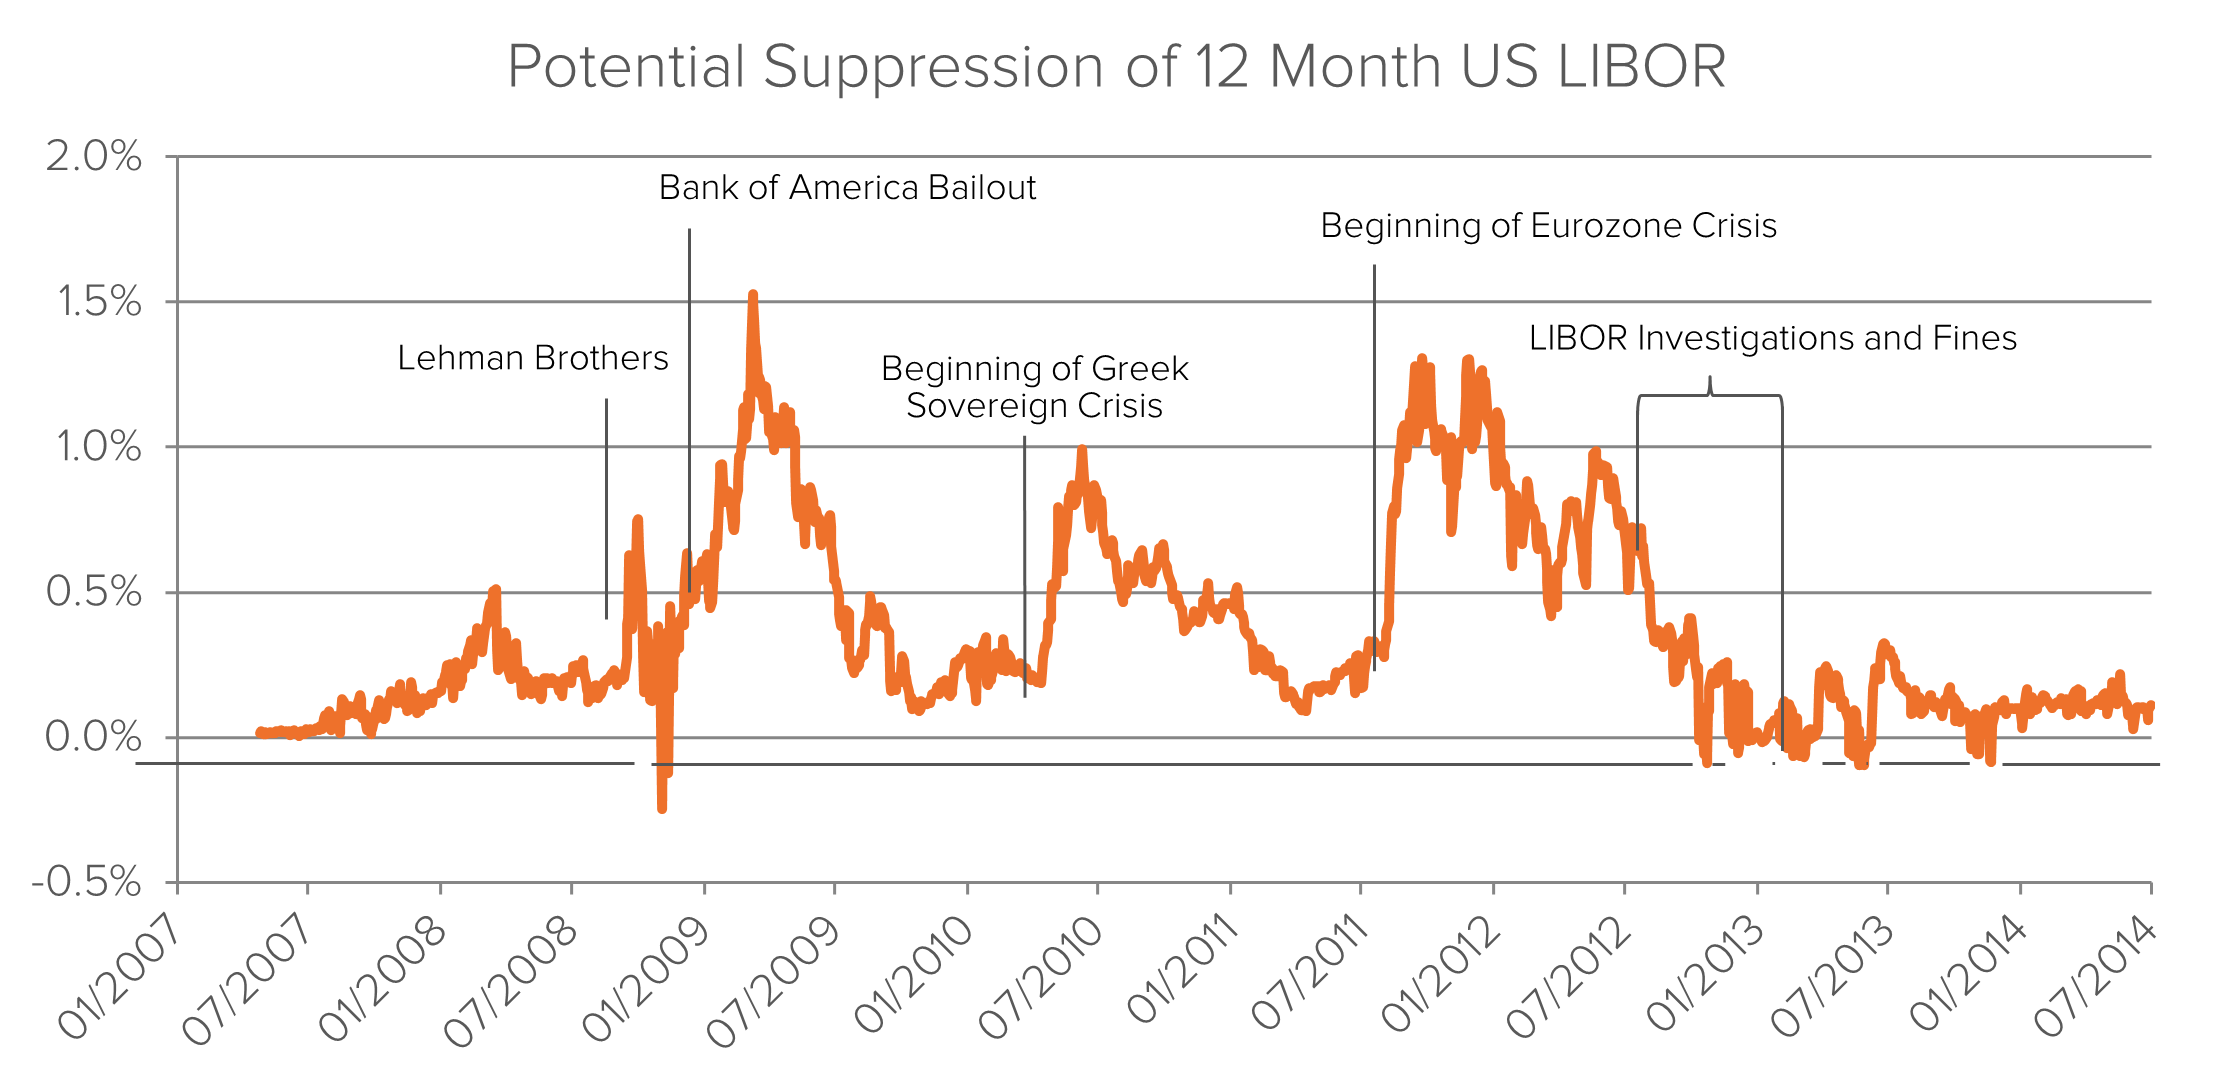 Fideres’s results suggest that:
Our original approach allowed us to identify potential manipulation of some bank’s LIBOR submissions on specific dates. The new methodology supplements our previous work by allowing us to estimate individual banks’ borrowing cost throughout the entire period and to determine by how much such bank’s LIBOR submission may have been suppressed. The graph below illustrates the results from our new analysis compared to our alternative approach taken previously.
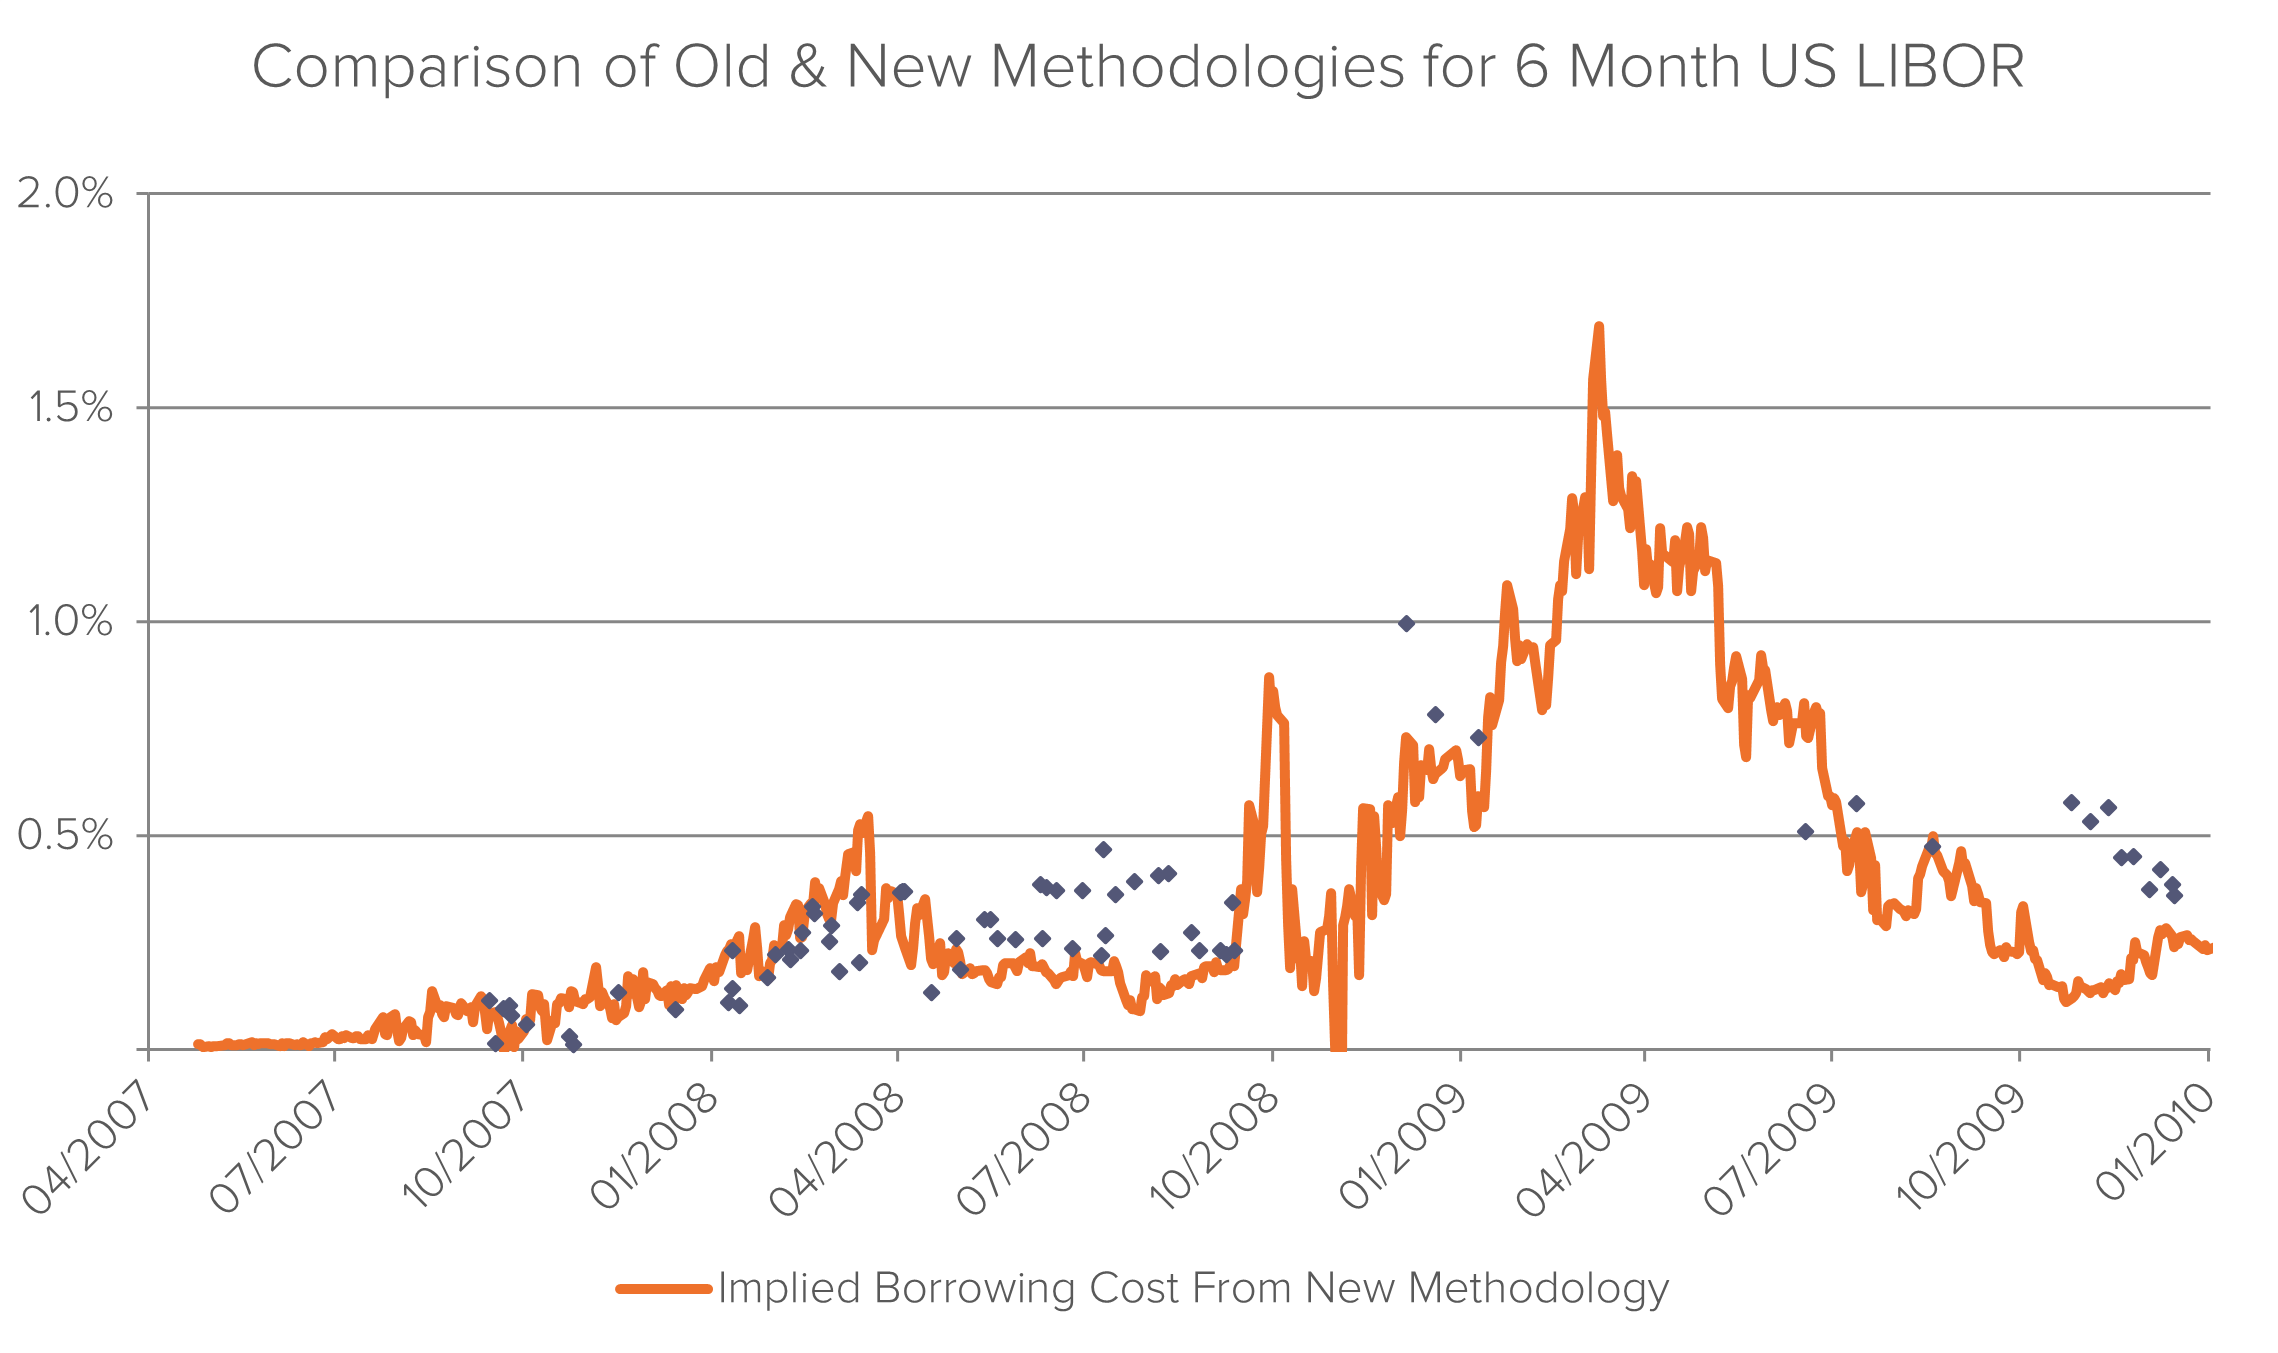 As one can see, our new methodology seems to provide a conservative estimate of the potential size of manipulation. It further allows us to supplement, validate and strengthen our previous findings and to overcome the issues of our previous approach to determine the size of manipulation for any date during the period.
In 2009, Alberto co-founded Fideres. As a partner, Alberto has mainly focused on developing market analyses and novel methodologies aimed at identifying anomalous or illicit behaviors such as: market manipulation, benchmark fixing manipulation, product mis-selling, anti-competitive conduct and discrimination conduct.
Since 2014 Alberto is the managing partner of Fideres Inc USA, Fideres’s US arm. Alberto has acted in an expert witness capacity in disputes involving banks and brokers, on one side, and institutional investors or consumers, on the other side. Examples of such disputes include mis-selling claims on complex financial derivative products and hedging solutions, LIBOR manipulation and fraud claims.
From 2005 to 2009, Alberto was head of Structured Products at the Royal Bank of Scotland in London, leading a team responsible for the structuring of synthetic credit derivatives products and customer driven solutions. In this capacity Alberto oversaw the development and execution of structured products such as CLOs, CDOs, credit default swaps, total return swaps.
From 2004 to 2005, Alberto led the Fixed Income team as Director, Head of Structuring at ABN AMRO. In this role, Alberto was responsible for the delivery of credit related solutions to institutional clients, for developing and executing regulatory capital and balance sheet solutions for global financial institutions, and for developing fund structure for the commercialization to private investors of structured products utilizing fund and insurance products platforms.
From 1997 to 2004, Alberto was at the UBS Limited as Fixed Income. Between 2003 and 2004 Alberto was Global Head of Structuring. In this role, Alberto led a team responsible for the Interest Rates and Credit Derivative Structured Products Desk.
Alberto began his career in New York, where he joined Credit Agricole in 1996 as an Associate in the Structured Products team.
Alberto holds two engineering Masters Degrees: from Ecole Centrale Paris, France and the Polythecnic of Turin, Italy. Alberto is fluent in Italian, French and Spanish.
Fideres outlines two methodological frameworks to estimate damages from pay-to-delay cases involving biosimilars.

The emerging pro-defendant class action landscape.

Fideres replicates ESMA’s study on closet indexers.


London: +44 20 3397 5160
New York: +1 646 992 8510
Rome: +39 06 8587 0405
Frankfurt: +49 61 7491 63000
Johannesburg: +27 11 568 9611
Madrid: +34 919 494 330