Key Points
- The United States (“US”) has some of the most expensive wireless plans in the developed world: the average price for 1 gigabyte (“GB”) of data was twice the OECD average in 2018.
- The mobile network market is highly vertically integrated, which presents competition concerns.
- Competition concerns in the US wireless industry look set to intensify with the adoption of 5G and the merger between T-Mobile and Sprint.
Introduction
Mobile data is more expensive in the US than in most developed nations. This has led to speculation that the market is characterized by anticompetitive practices. Prior studies have focused largely on horizontal concentration between wireless carrier networks.
However, Fideres’s analysis suggests that this focus may be misplaced. Our research shows that the real grounds for concern lie further down the supply chain. In particular, the market for business data services (“BDS”), which provides the connection between cell towers and the internet backbone, and is therefore an essential service to wireless carriers, gives rise to a range of competition concerns.
High Prices in the US Carrier Market
A global survey on the average price for one GB of data placed the US as 42nd most expensive out of 230 countries reviewed (Cable, 2019). Most of the countries with more expensive tariffs were developing nations, only four being members of the OECD.
US calls and text message costs are also among the highest globally. When ranked in terms of purchasing power parity, the US placed as 18th most expensive out of 174 countries reviewed (ITU, 2015). Only three countries with more expensive plans were members of the OECD.
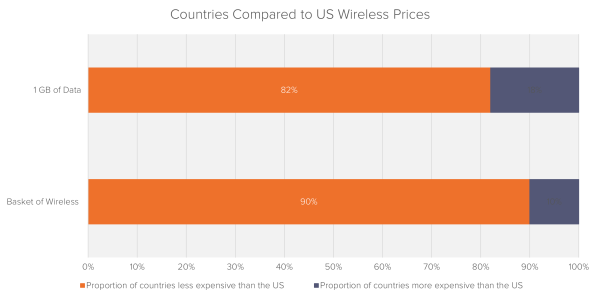
Source: Cable, ITU, Fideres
In a more direct comparison to 41 developed nations, the US market offered the 4th least amount of data for €30 (Rewheel, 2018).
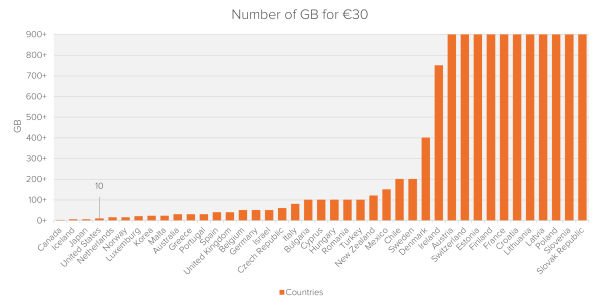
Source: Rewheel, Fideres
Why High Prices Don’t Tell the Whole Story
Market Concentration
A lack of competition within the US wireless carrier market has been cited as a potential cause of high prices. However, the international evidence does not support this theory. The average number of wireless carriers, who operate their own network, per nation in the OECD is 3.6, the US has 4.
| Number of Carriers | Count of OECD Countries | Proportion of OECD Countries |
|---|---|---|
| 3 | 19 | 54% |
| 4 | 13 | 37% |
| 5+ | 3 | 9% |
Source: OECD
Profits
A clear indicator of anti-competitive behavior is the presence of super-normal profits. A possible method to determine the existence of such profits is to compare an industry to its international counterparts. The North American industry does, indeed, exhibit higher average revenues per user (“ARPU”) than its international counterparts:
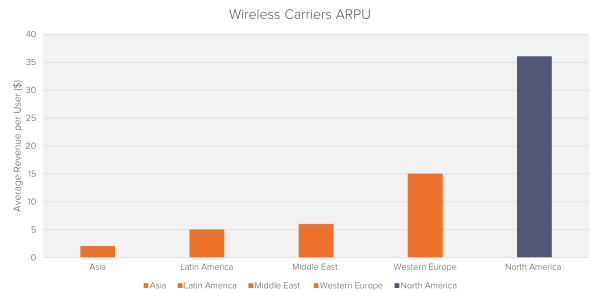
Source: PWC
These higher revenues, however, do not appear to be converted into higher profits. For two accounting measures of profitability, EBITDA margin and NOPAT margin,1 the North American value is in line with its global counterparts.
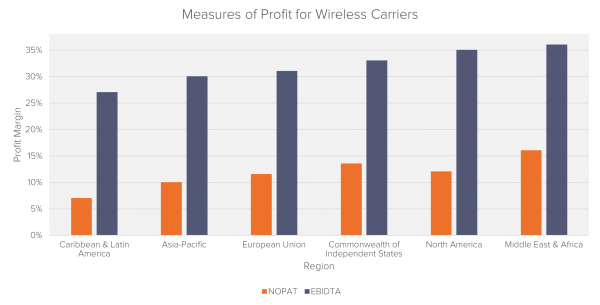
Source: Applied Value
Given that higher revenues are not being converted into superior profit margins, it is likely North American carriers have a greater proportion of turnover absorbed through their operating costs.
Competition Concerns in the Supply Chain
In order to transport calls, SMS and internet data traffic across the country carriers are required to access the same cables which service broadband and landline connections. This shared infrastructure is known as the “internet backbone”. This connection between cell phone towers and the internet backbone is a portion of the BDS market.
The two largest providers of BDS, AT&T and Verizon, are also the two largest carriers in the US. This vertical integration is a clear advantage as BDS constitutes a major cost of operation. The ex-FCC chairman Clyburn stated that BDS can constitute up to 30% of a carriers operating expense (Fierce Telecom, 2016). It was reported that in 2016 Sprint, the 4th largest carrier, were paying up to a billion dollars a year (Bloomberg, 2016). Much of this expense was revenue for its competitors AT&T and Verizon.
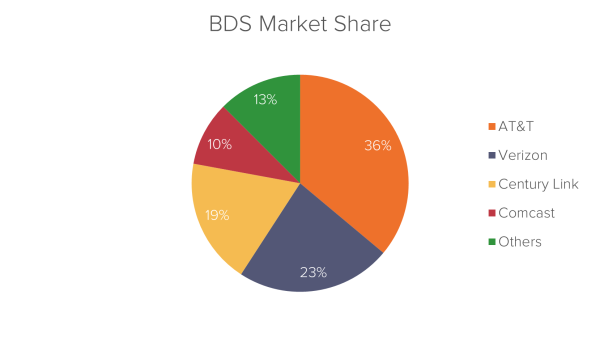
Source: Fideres, Company Accounts
The Herfindahl-Hirschman Index (HHI) is widely used to gauge the concentration of a market. The HHI for the BDS industry is 2,331.2 According to DOJ guidelines this makes the market ‘moderately’ concentrated. This figure is a national aggregate and does not tell the whole story: on a regional level, the BDS market is far more concentrated.
Connection to the internet backbone was historically operated by licensed state monopolies before being opened to commercial competition in 1996. A 2016 FCC commissioned study found that this competition had failed to materialize, citing that 77% of sites serviced by BDS had access to only one supplier (FCC, 2016).
| Number of BDS Providers | Count of Buildings | Proportion of Buildings |
|---|---|---|
| 1 | 939,638 | 77% |
| 2 | 265,708 | 22% |
| 3 | 9,482 | 1% |
| 4+ | 2,148 | 0% |
Source: FCC
This results in the national market for BDS being dominated by the two largest carriers, and most localities being a monopoly for one of these. This is a competition concern directly for BDS consumers and indirectly for wireless consumers.
Sprint has long called for widespread reform arguing BDS provision is a ‘non-competitive market’ and ‘broken’ (Sprint, 2016). These competition concerns have been noted by the EU who stated that the market is ‘harmful for consumers and competition’ and represents an ‘imbalance in BDS regulatory practice[…] between the US and the EU and other nations’ (EU, 2017). There are also extremely high barriers to entry in this market. A new company would have to lay cables across the length of the country to compete on a national scale.
These competition concerns are further compounded by the cross ownership of the largest BDS providers by institutional investors. Three investment firms (Vanguard, BlackRock & State Street) own a minimum of 12% of the four biggest companies in the market and a minimum of 15% in the two largest.
| AT&T | Verizon | CenturyLink | Comcast | ||||
|---|---|---|---|---|---|---|---|
| Vanguard | 7% | Vanguard | 7% | Temasek | 10% | Vanguard | 8% |
| BlackRock | 4% | BlackRock | 5% | Vanguard | 10% | BlackRock | 4% |
| State Street | 4% | State Street | 4% | BlackRock | 6% | State Street | 4% |
Source: Bloomberg
New Problems on the Horizon
Deregulation and Removal of Price Caps
An FCC report commissioned in 2016 raised serious concerns about the level of concentration in the BDS sector, finding that 77% of BDS consumer sites had access to only one supplier (FCC, 2016). As a response to this high degree of concentration, and the likelihood that it was driving monopolistic pricing in some regional markets, FCC chair Tom Wheeler proposed imposing 11% lower price caps in monopolistic BDS markets (FCC, 2016).
This proposed reform never took place. Instead, in 2017, the FCC under the stewardship of Ajit Pai reversed its position on the issue, disregarding the 2016 report and abandoning Wheeler’s suggested price caps, and instead taking steps to deregulate the market even further. Although prior FCC market definitions had been based on the existence of physical infrastructure (such as cable), Pai called for a redefinition of a competitive market to include any regions where a competing supplier is “nearby” or within “a half mile” (FCC, 2017). This resulted in the removal of the pre-existing price caps from over 90% of BDS markets (Reuters, 2017).
Because the laying cables over half a mile is a costly procedure and does not represent active competition, the Computer & Communications Industry Association (CCIA) president Ed Black predicted Pai’s order “would not effectively promote competition” and instead “lead to price increases that would ultimately be borne by consumers” (CCIA, 2017).
Increase in BDS Requirements with 5G
The advent of 5G looks set to increase carrier’s reliance on BDS. The radio wave frequency carrying 5G has much lower penetration than its 4G predecessor. This means that waves transporting data between cell phones and network towers are more easily blocked by buildings. This will result in a large increase in the number of towers required to maintain current levels of network coverage and as a result the number of BDS connections.
Verizon and AT&T have begun to offer 5G to select customers in a handful of cities, looking to expand this coverage in coming years. Sprint and T-Mobile have announced imminent 5G expansion as well. This looks set to intensify the problem of high wireless plan prices due to 5Gs increased reliance on BDS.
Ongoing Market Consolidation
T-Mobile and Sprint, the third and fourth largest MNOs in the US, submitted a merger proposal to the FCC in June 2018. If approved, this merger will see the newly formed company become the third largest carrier in the US.
| Wireless Carrier | Subscribers | Proportion of Subscribers |
|---|---|---|
| Verizon | 153m | 36% |
| AT&T | 147m | 34% |
| T-Mobile | 76m | 18% |
| Sprint | 54m | 13% |
Source: Strategy Analytics
This merger will consolidate an already concentrated market and presents serious competition concerns for American consumers.
Conclusion
The future for wireless consumers in the US looks troubling. Deregulation of the BDS market has the potential to push up BDS prices. This is occurring at a time where the introduction of 5G will greatly increase wireless carriers reliance on the concentrated BDS market. This combined with the proposed merger between Sprint and T-Mobile reducing the competition at the wireless carrier level is likely to put upward pressure on wireless prices which are already among the most expensive in the world.
Sources
1 NOPAT – Net operating profit after tax
2 Provisional calculation by company revenue