
Research
Are Corporations Overpaying Interest When They Issue Bonds?
Evidence indicates systemic underpricing of corporate bonds.

The outbreak of COVID-19 led to widespread fear among investors, resulting in a market crash and surge in volatility not seen since the 2008 financial crisis. The wave of selling reached its peak on March 16, soon after the WHO’s announcement characterizing COVID-19 as a pandemic1, with equity market indices such as the S&P 500 and the Nasdaq falling by 13%. The CBOE Volatility Index (VIX), a common measure of expected equity market volatility, surged to 82.7 percentage points surpassing its 2008 record.
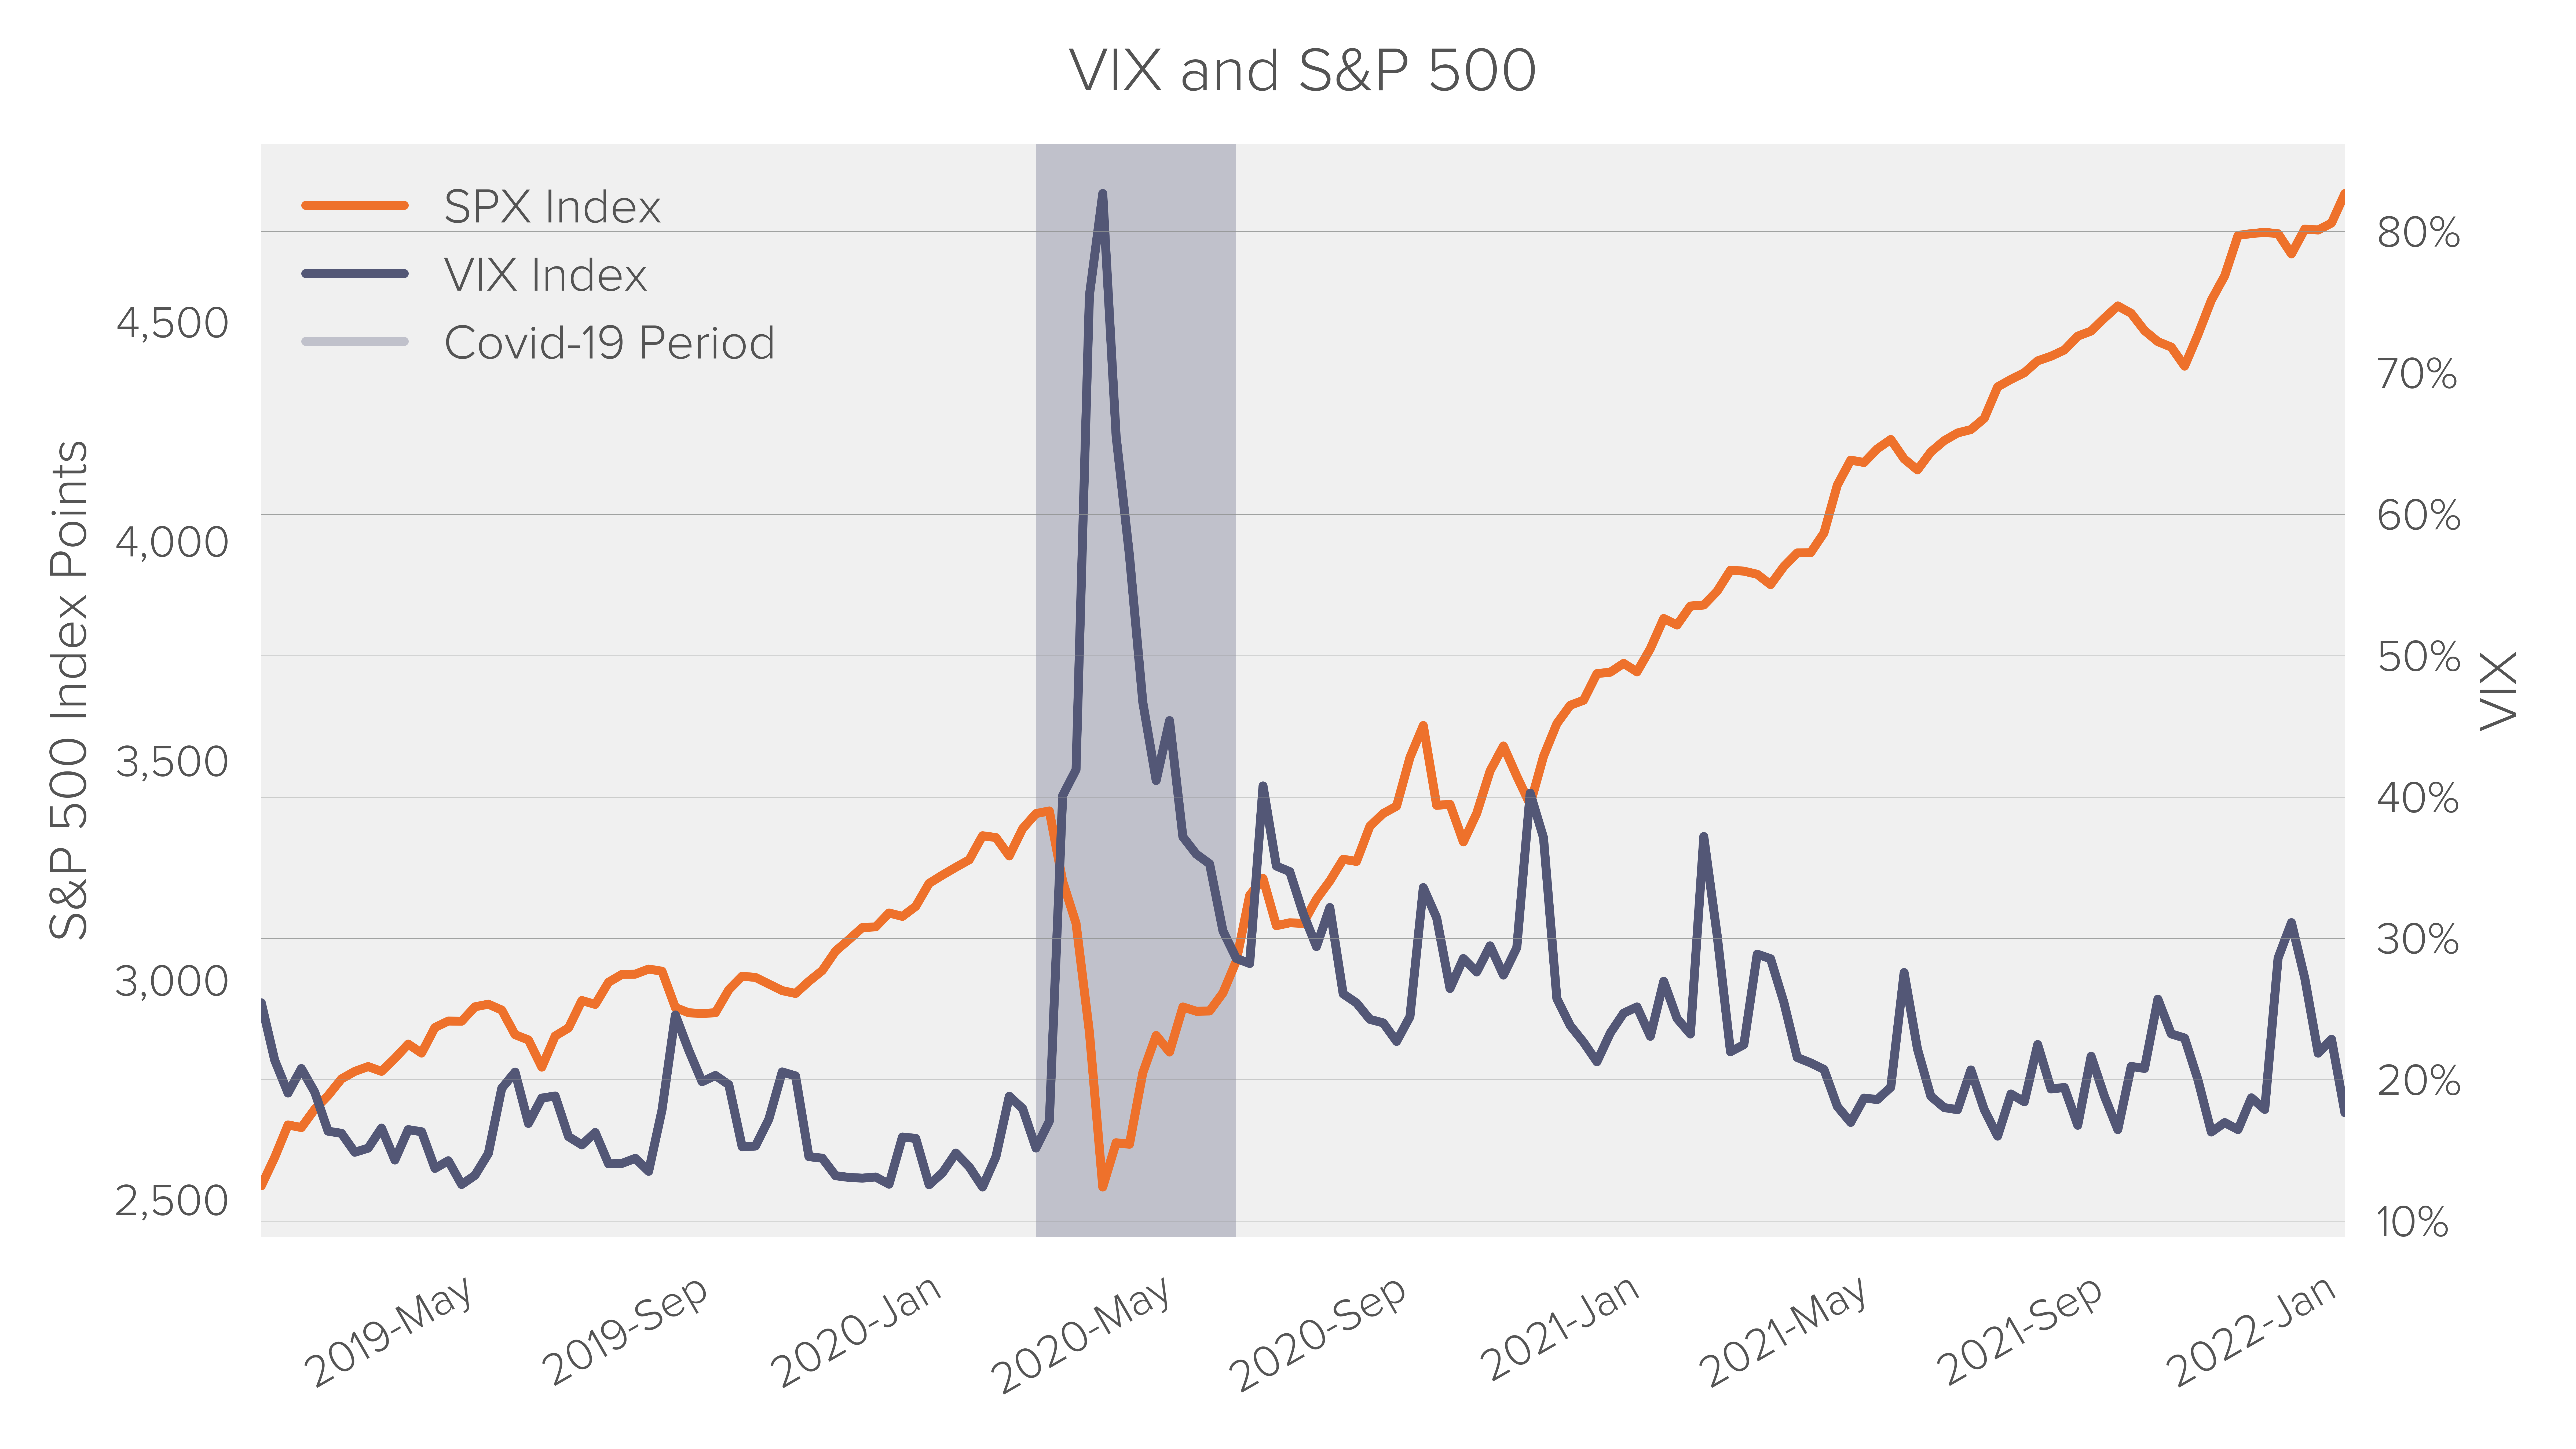
For all major equity indices very large declines and increases occurred much more frequently during the first COVID-19 period (February 11 to May 31, 2020) than before or after.
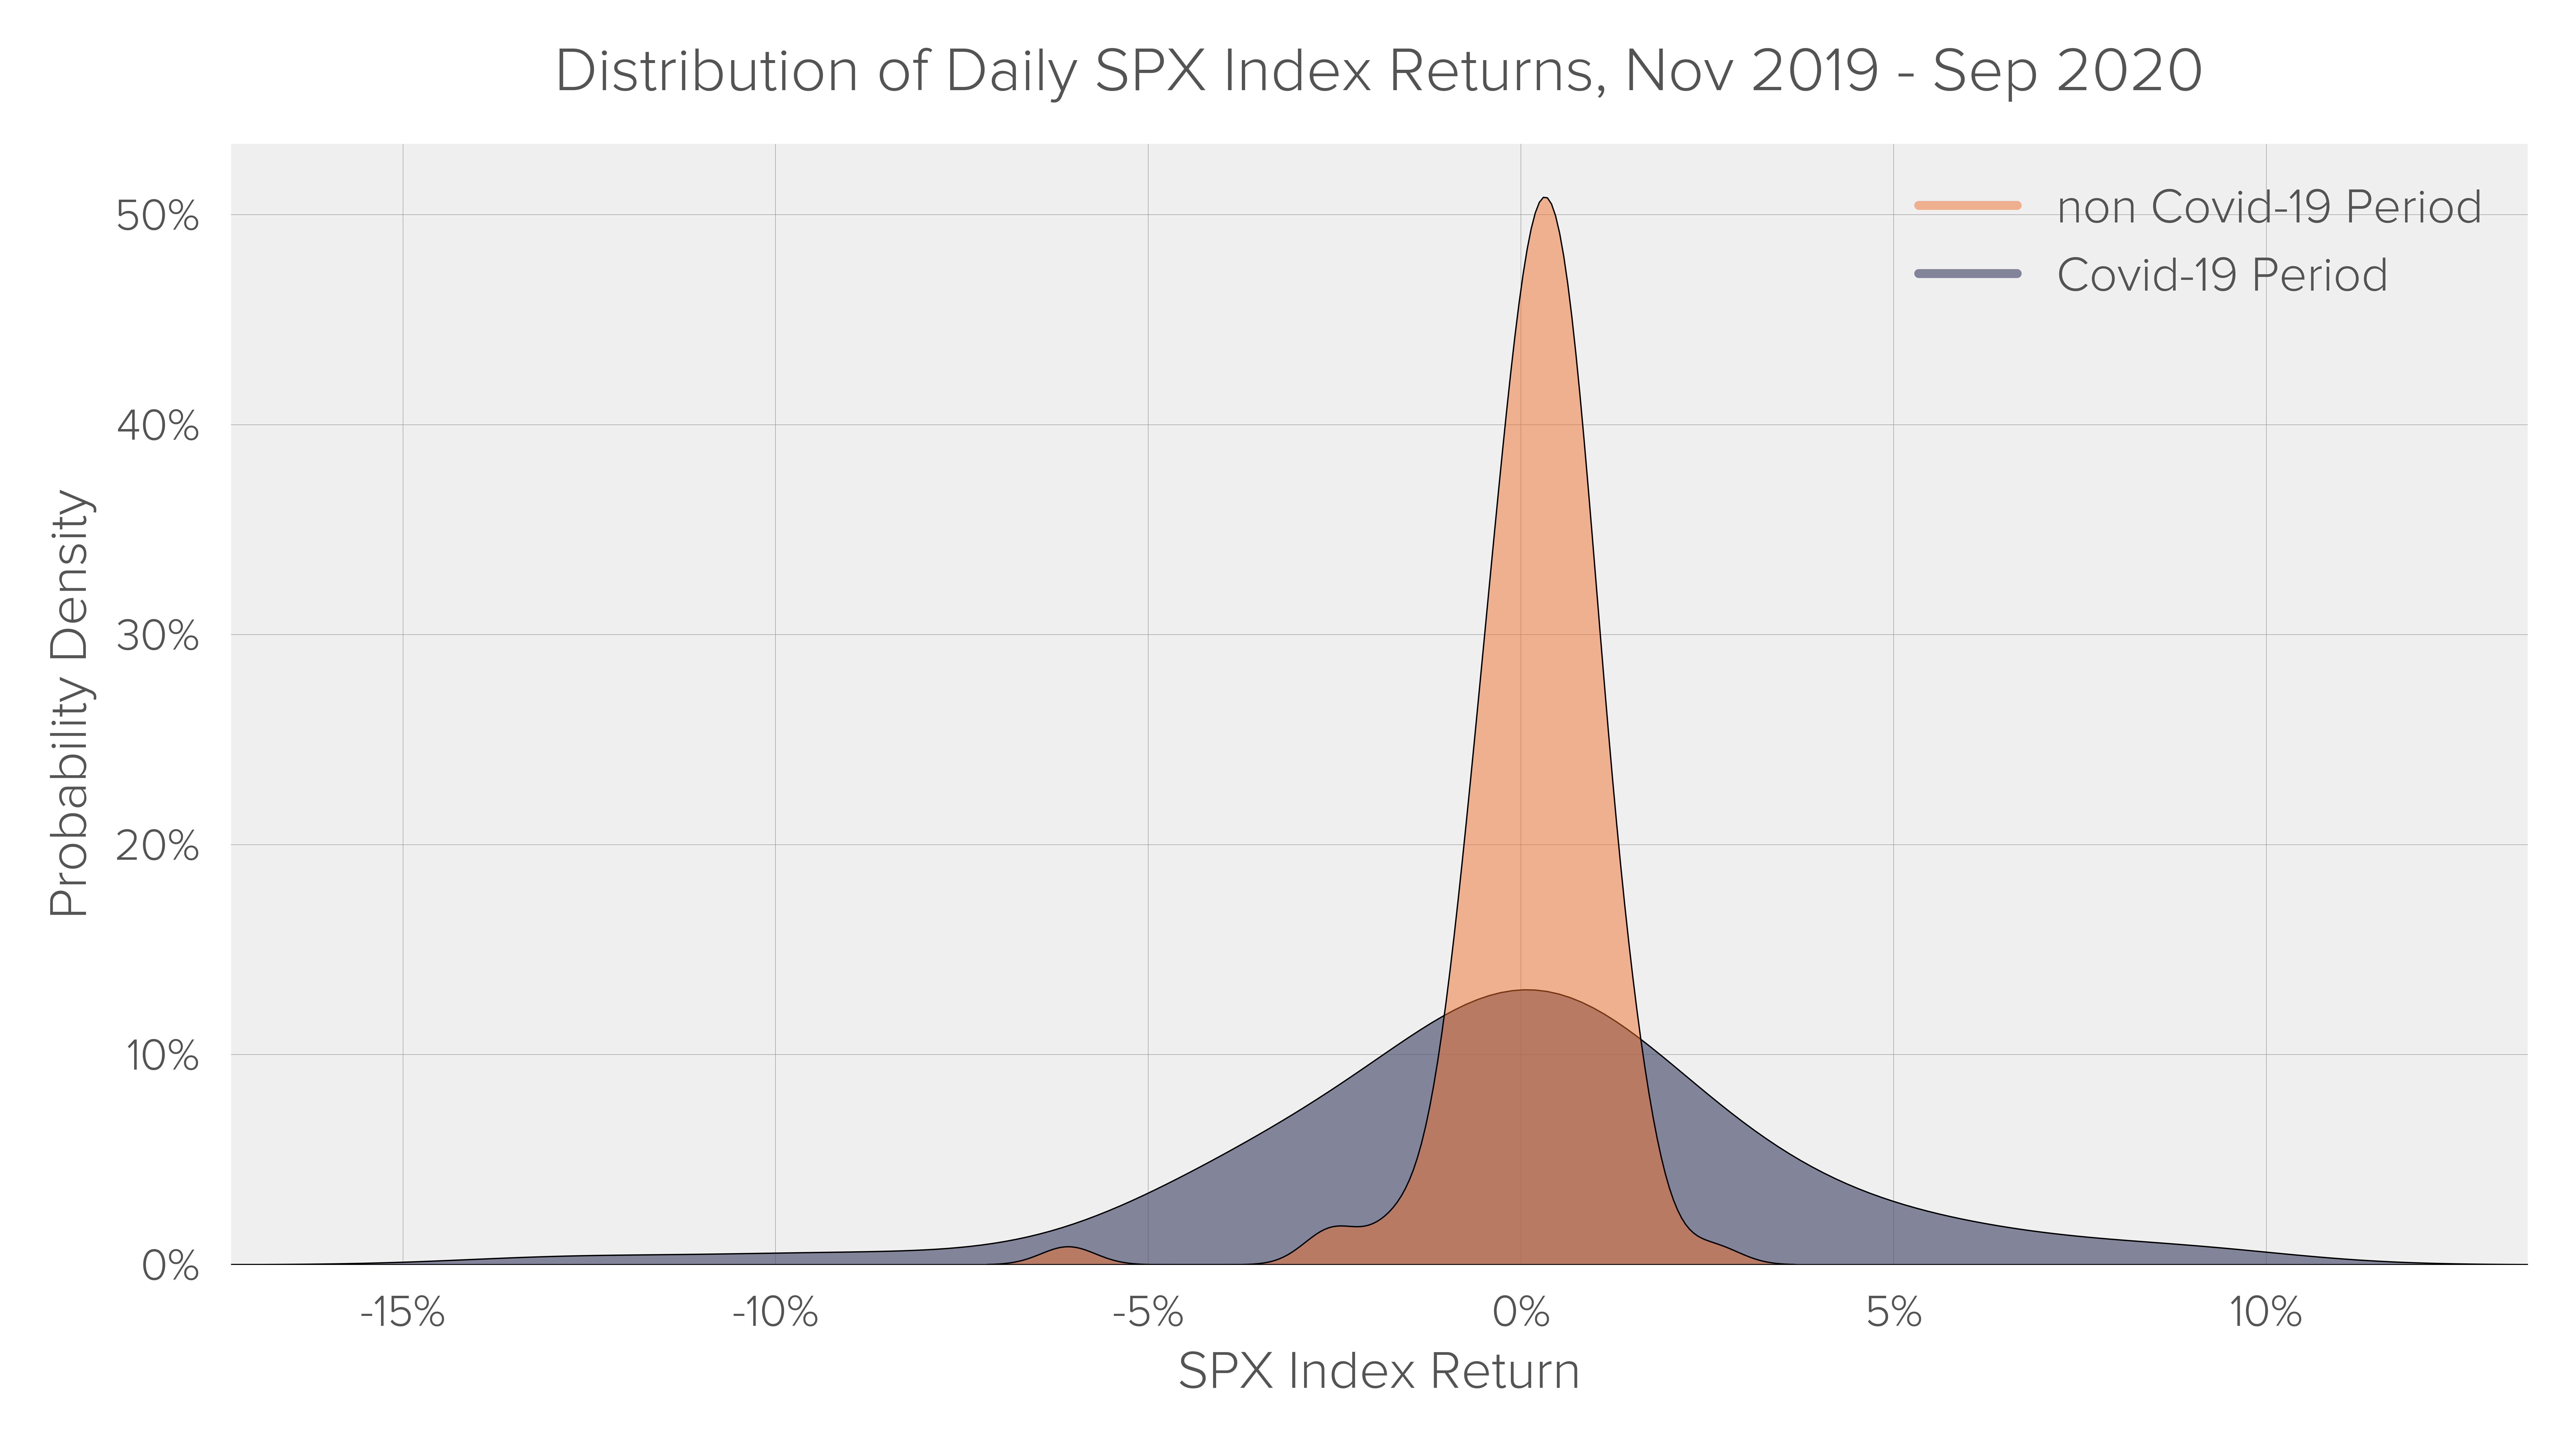
The surge in volatility during the COVID-19 period can be seen in the distribution of daily SPX Index returns. The heavier tails in the return distribution during the COVID-19 period show that there is a much larger likelihood of observing extreme positive or negative returns.
This clearly visible structural change in market-wide volatility which often accompanies large stock market crashes has important implications for the statistical models utilized by financial economists in securities litigations.
In 10b-5 securities litigations, financial economists commonly use an event study to show market efficiency, price impact, loss causation and to calculate damages. In an event study analysis, a (rolling) regression model is used to examine the relationship between the daily returns of the security in question, and relevant market and industry indices.
However, surges in market-wide volatility, such as during the COVID-19 pandemic, can potentially cause statistical inferences in conventional event studies to become unreliable.2
For example, if the regression model is calibrated using data that falls outside of the COVID-19 period, while the corrective disclosure3 falls within the COVID-19 period, the analysis may yield a large number of statistically significant price changes which are however only a byproduct of the generally high level of volatility during this period. Such results are also known as ‘false positives’ and can create issues for class certification.
Conversely, if the event study is calibrated using data falling inside the COVID-19 period, relevant news dates outside the period may not be identified as statistically significant as the model incorporates an increased level of volatility to which the price change on the disclosure date is compared to, i.e., false negatives.
The following table summarizes the potential errors that may arise when performing a standard event study analysis that is affected by COVID-19:
| Corrective Disclosure Falls Outside the COVID-19 Period | Corrective Disclosure Falls Inside the COVID-19 Period | |
| Event Study Model Calibrated Outside the COVID-19 Period | Conventional event study is typically sufficient | False positives due to underestimation of volatility, i.e., identification of too many statistically significant stock movements |
| Event Study Model Calibrated Inside the COVID-19 Period | False negatives due to overestimation of volatility, i.e., large price changes following relevant disclosures show as insignificant | False Positives or False Negatives possible; careful analysis of data and calibration period required |
We demonstrate the effect that the COVID-19 period has on event studies by performing a standard regression analysis (ordinary least square regression or OLS) on The GEO Group, Inc.4 (GEO) which does not account for different volatility regimes.
It is alleged that GEO failed to maintain proper COVID-19 procedures, endangering the health of residents staying in its halfway houses, and opening the company up to significant financial risk. The period in which this is said to have taken place runs from Feb 27, 2020 to June 16, 2020 (Class Period).
The price chart below shows GEO’s stock price throughout the Class Period. As can be seen, the stock price drop resulting from the revelation of GEO’s improper COVID-19 procedures is of similar magnitude as the large stock price declines in March caused by COVID-19.
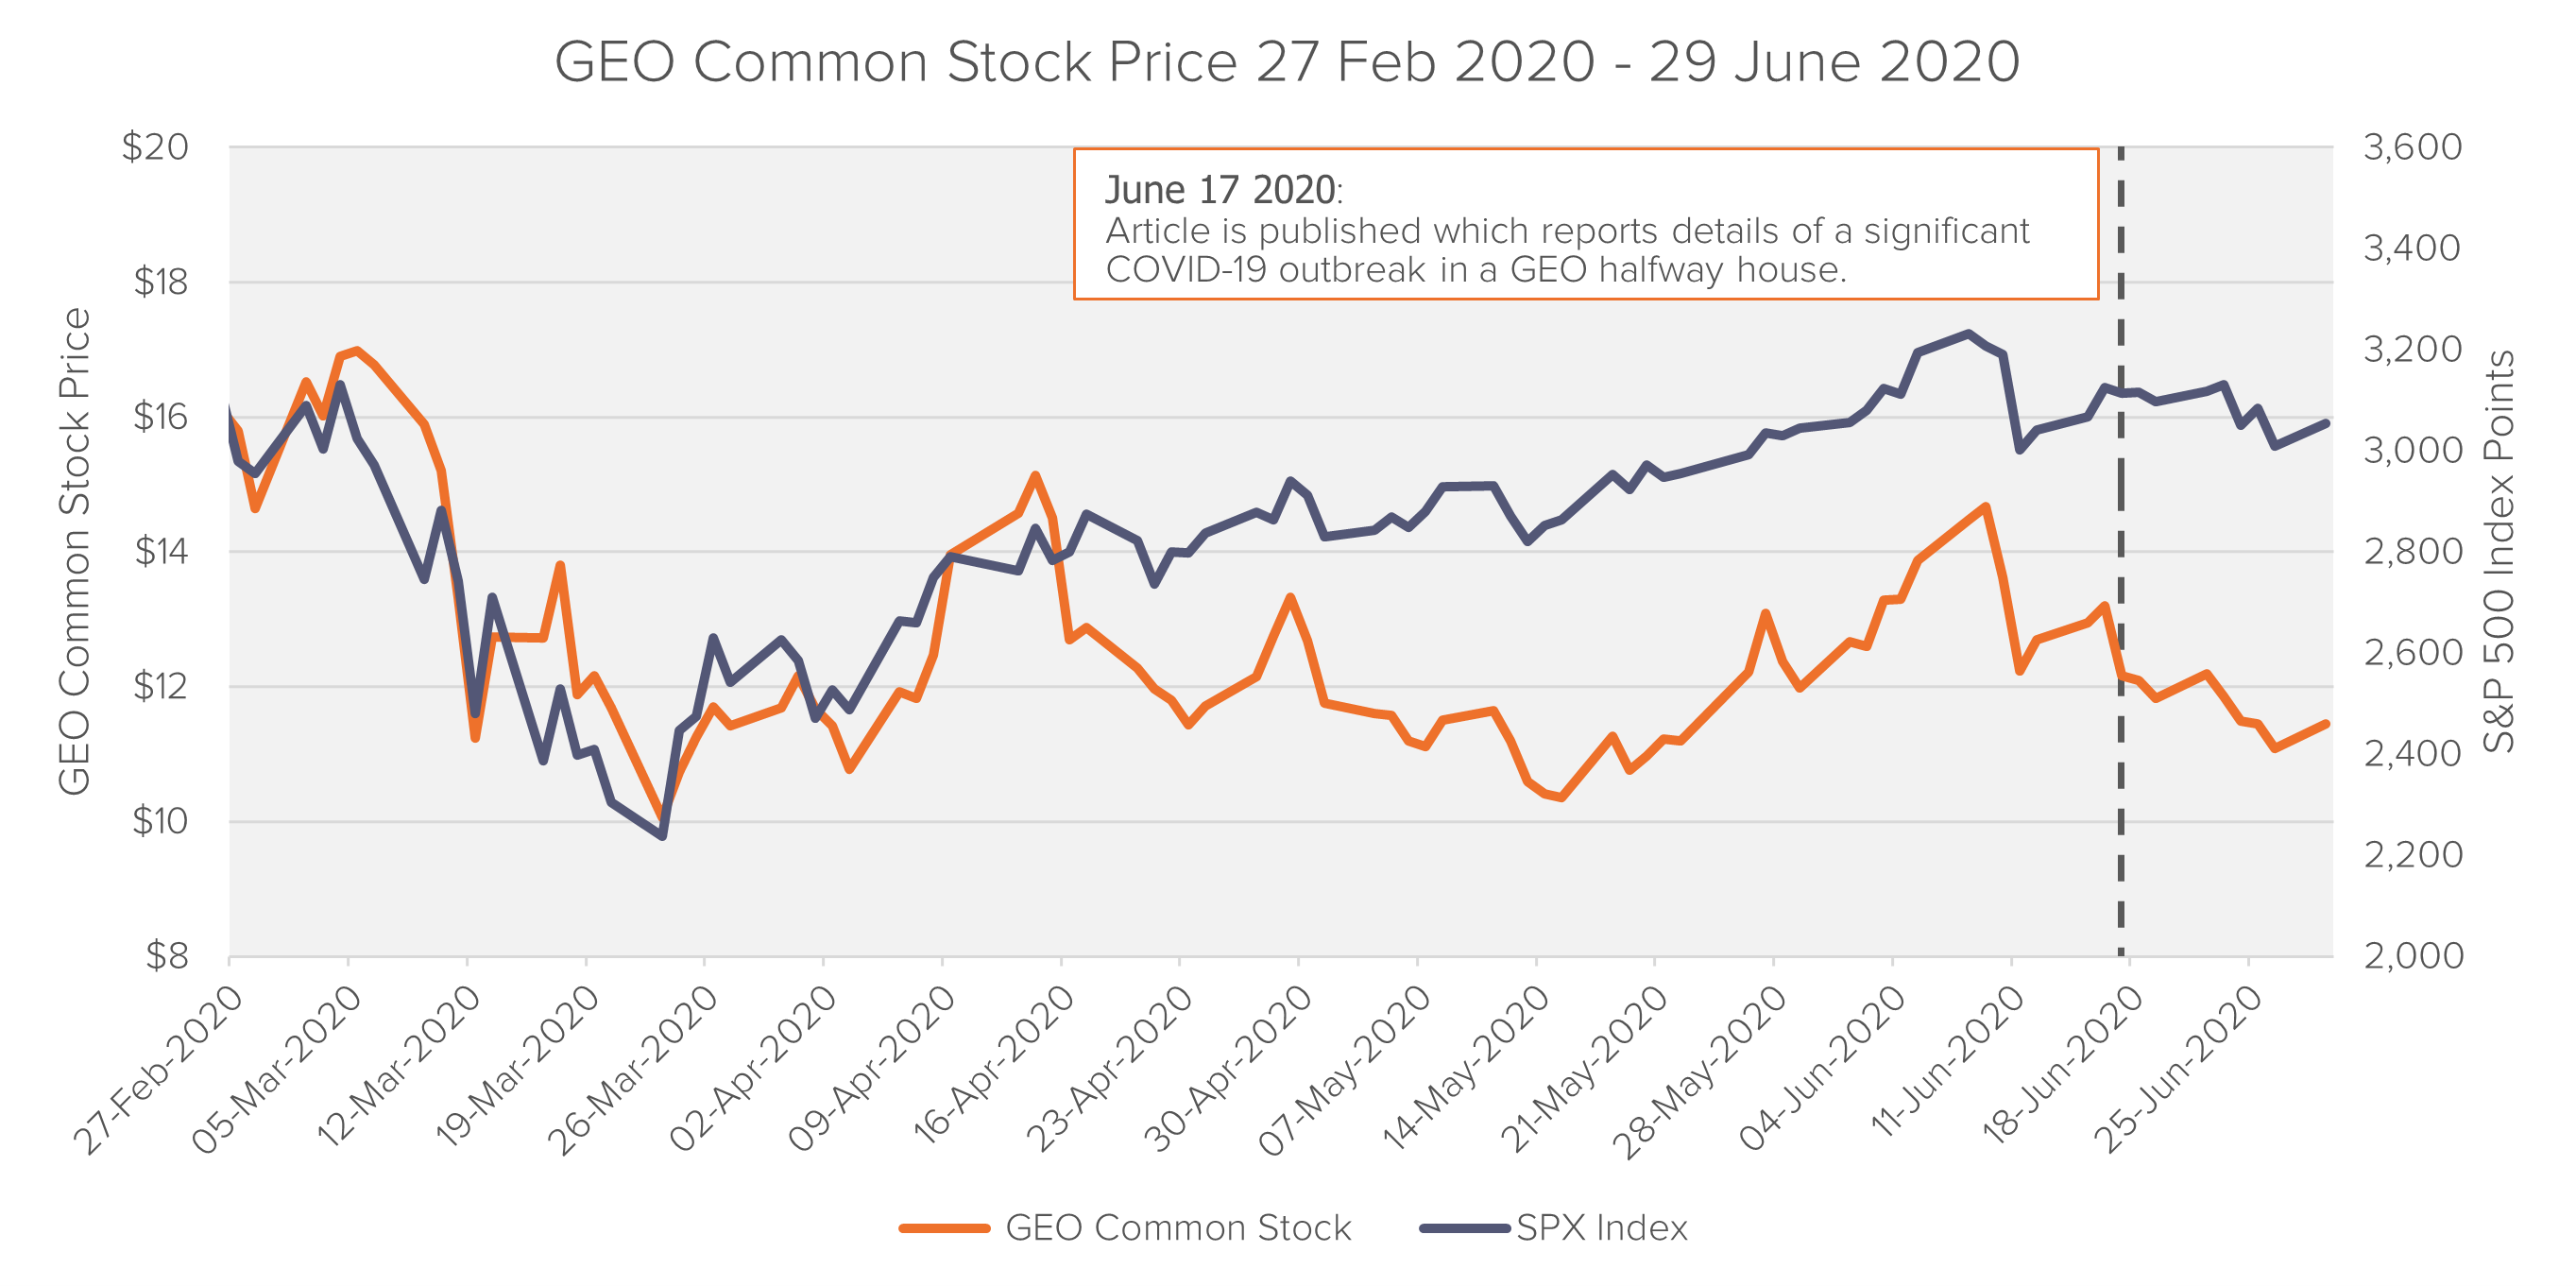 Source: Bloomberg, Fideres’s calculations
Standard regression analysis fails to identify the relevant news on the corrective disclosure date, June 17, 2020 as significant at the 95% level5, even though GEO’s stock price dropped by 8% on this day.
As discussed above, assumptions made by the conventional event study model are potentially not sufficient to reflect the market conditions during the COVID-19 period. Consequently, financial economists need to consider reasonable advanced methods to achieve robust statistical inferences6.
In the example above, using an extension of the standard Ordinary Least Squares regression model (OLS), the Generalized Least Squares model (GLS)7, which incorporates two different volatility regimes, identifies the corrective disclosure date with a 99% significance.
Other established modelling techniques like GARCH models8 or Markov-Switching models9, which account for changing volatility regimes, may also improve the statistical power of the regression analysis.
1 WHO Director-General’s opening remarks at the media briefing on COVID-19 – 11 March 2020
2 See Baker, Andrew C. “Single-Firm Event Studies, Securities Fraud, and Financial Crisis: Problems of Inference.” Stanford Law Review 68.5 (2016): 1207.
3 A “corrective disclosure’” refers to days on which relevant news is released that corrects a company’s previous false or misleading statements.
4 This event study is performed for illustrative purposes only, Fideres does not express a view as to whether or not GEO omitted to disclose relevant information or misrepresented any facts. The results shall not be construed to present Fideres’s opinion as to market efficiency, causation, or quantum in this case.
5 The 95% statistical significance level is widely accepted as ‘the standard’ in event studies used in securities litigation cases and requires corrective disclosures to have a p-value below 5% to be considered significant.
6 Similar issues also arose in 10b-5 claims filed after the 2008 Great Financial Crisis, See In re. Countrywide Financial Corporation Securities Litigation, Case No. CV 07-05295 MRP, Dkt 987-4. See also In re. Federal Home Loan Mortgage Corp. (Freddie Mac) Securities Litigation, Case No. 1:09-MD-2072 (MGC), Dkt 125-1.
7 The GLS model is a generalization of the OLS model that allows one to incorporate periods of different volatility.
8 A GARCH model is a volatility model which uses past observations to describe the variance of the current observation.
9 A Markov model is a popular type of ‘regime’ switching model. It tries to account for time-series data that may cycle through periods of behavior, or regimes, i.e., volatile behavior and non-volatile behavior during COVID 19 and non-COVID 19 periods.
Andres joined Fideres in September 2021 after completing his MSc in Financial Technology at Imperial College Business School with distinction. Prior to that he undertook a Banking and Finance BSc at Frankfurt School of Finance & Management and acquired work experience in both Frankfurt and Luxembourg. Since joining Fideres, Andres has worked on financial benchmark manipulation, financial spoofing, and securities litigation cases, with a focus on class certification and market efficiency reports.

Evidence indicates systemic underpricing of corporate bonds.


Fines for Standard & Poor’s are too little, too late.


Evidence of collusive behaviour In academic publishing.


London: +44 20 3397 5160
New York: +1 646 992 8510
Rome: +39 06 8587 0405
Frankfurt: +49 61 7491 63000
Johannesburg: +27 11 568 9611
Madrid: +34 919 494 330