
Research
Cross Holdings And Competition
Could highly concentrated holdings lead to anticompetitive behavior?

The prepayment energy market is a large segment of the total UK energy sector – with prepayment meters (PPMs) accounting for around 10 – 15% of English/Welsh meters, and approximately four million households.1
Using data from the Census2 and Department for Business, Energy, & Industrial Strategy,3 we mapped the geographic distribution of both prepayment meters and areas with large minority ethnic populations. Doing so, we found that large urban centers, such as London, Manchester, and Birmingham have both substantial minority ethnic populations and widespread prepayment meter use. Outside these urban areas, the population is predominantly white, and there are exceedingly few prepayment meters.
We also found that there are two main drivers of PPM use:
Other research reaches similar conclusions. A February 2021 report from the University of Bristol Personal Finance Research Centre (PFRC) describes how low-income households often have PPMs imposed on them if they have fallen into debt. Some households use PPMs because they are unable to change to a standard credit meter. “Financial exclusion” (being unable to pay by direct debit) and “digital exclusion” (not having access to the internet) are also factors contributing to low-income households being less able to switch to the best deals.4 Joseph Rowntree Foundation (JRF) research has also identified PPM use as a type of poverty premium which, as of 2015, was incurred by 2.6 million (33%) low-income households.5
Over the past decade, consistently 35-45% of customers repaying debt to their supplier did so through a PPM. Some of these will have chosen to repay via PPM, but others were required to by their supplier. In 2018, 70,981 PPMs were installed under court warrant to collect debt.6 On paper, households may transfer up to £500 of debt from one provider to another, but the reality is more complicated. The Competition and Markets Authority (CMA) found that debt assignment protocols, which dictate how debt is transferred, create barriers to substitution.
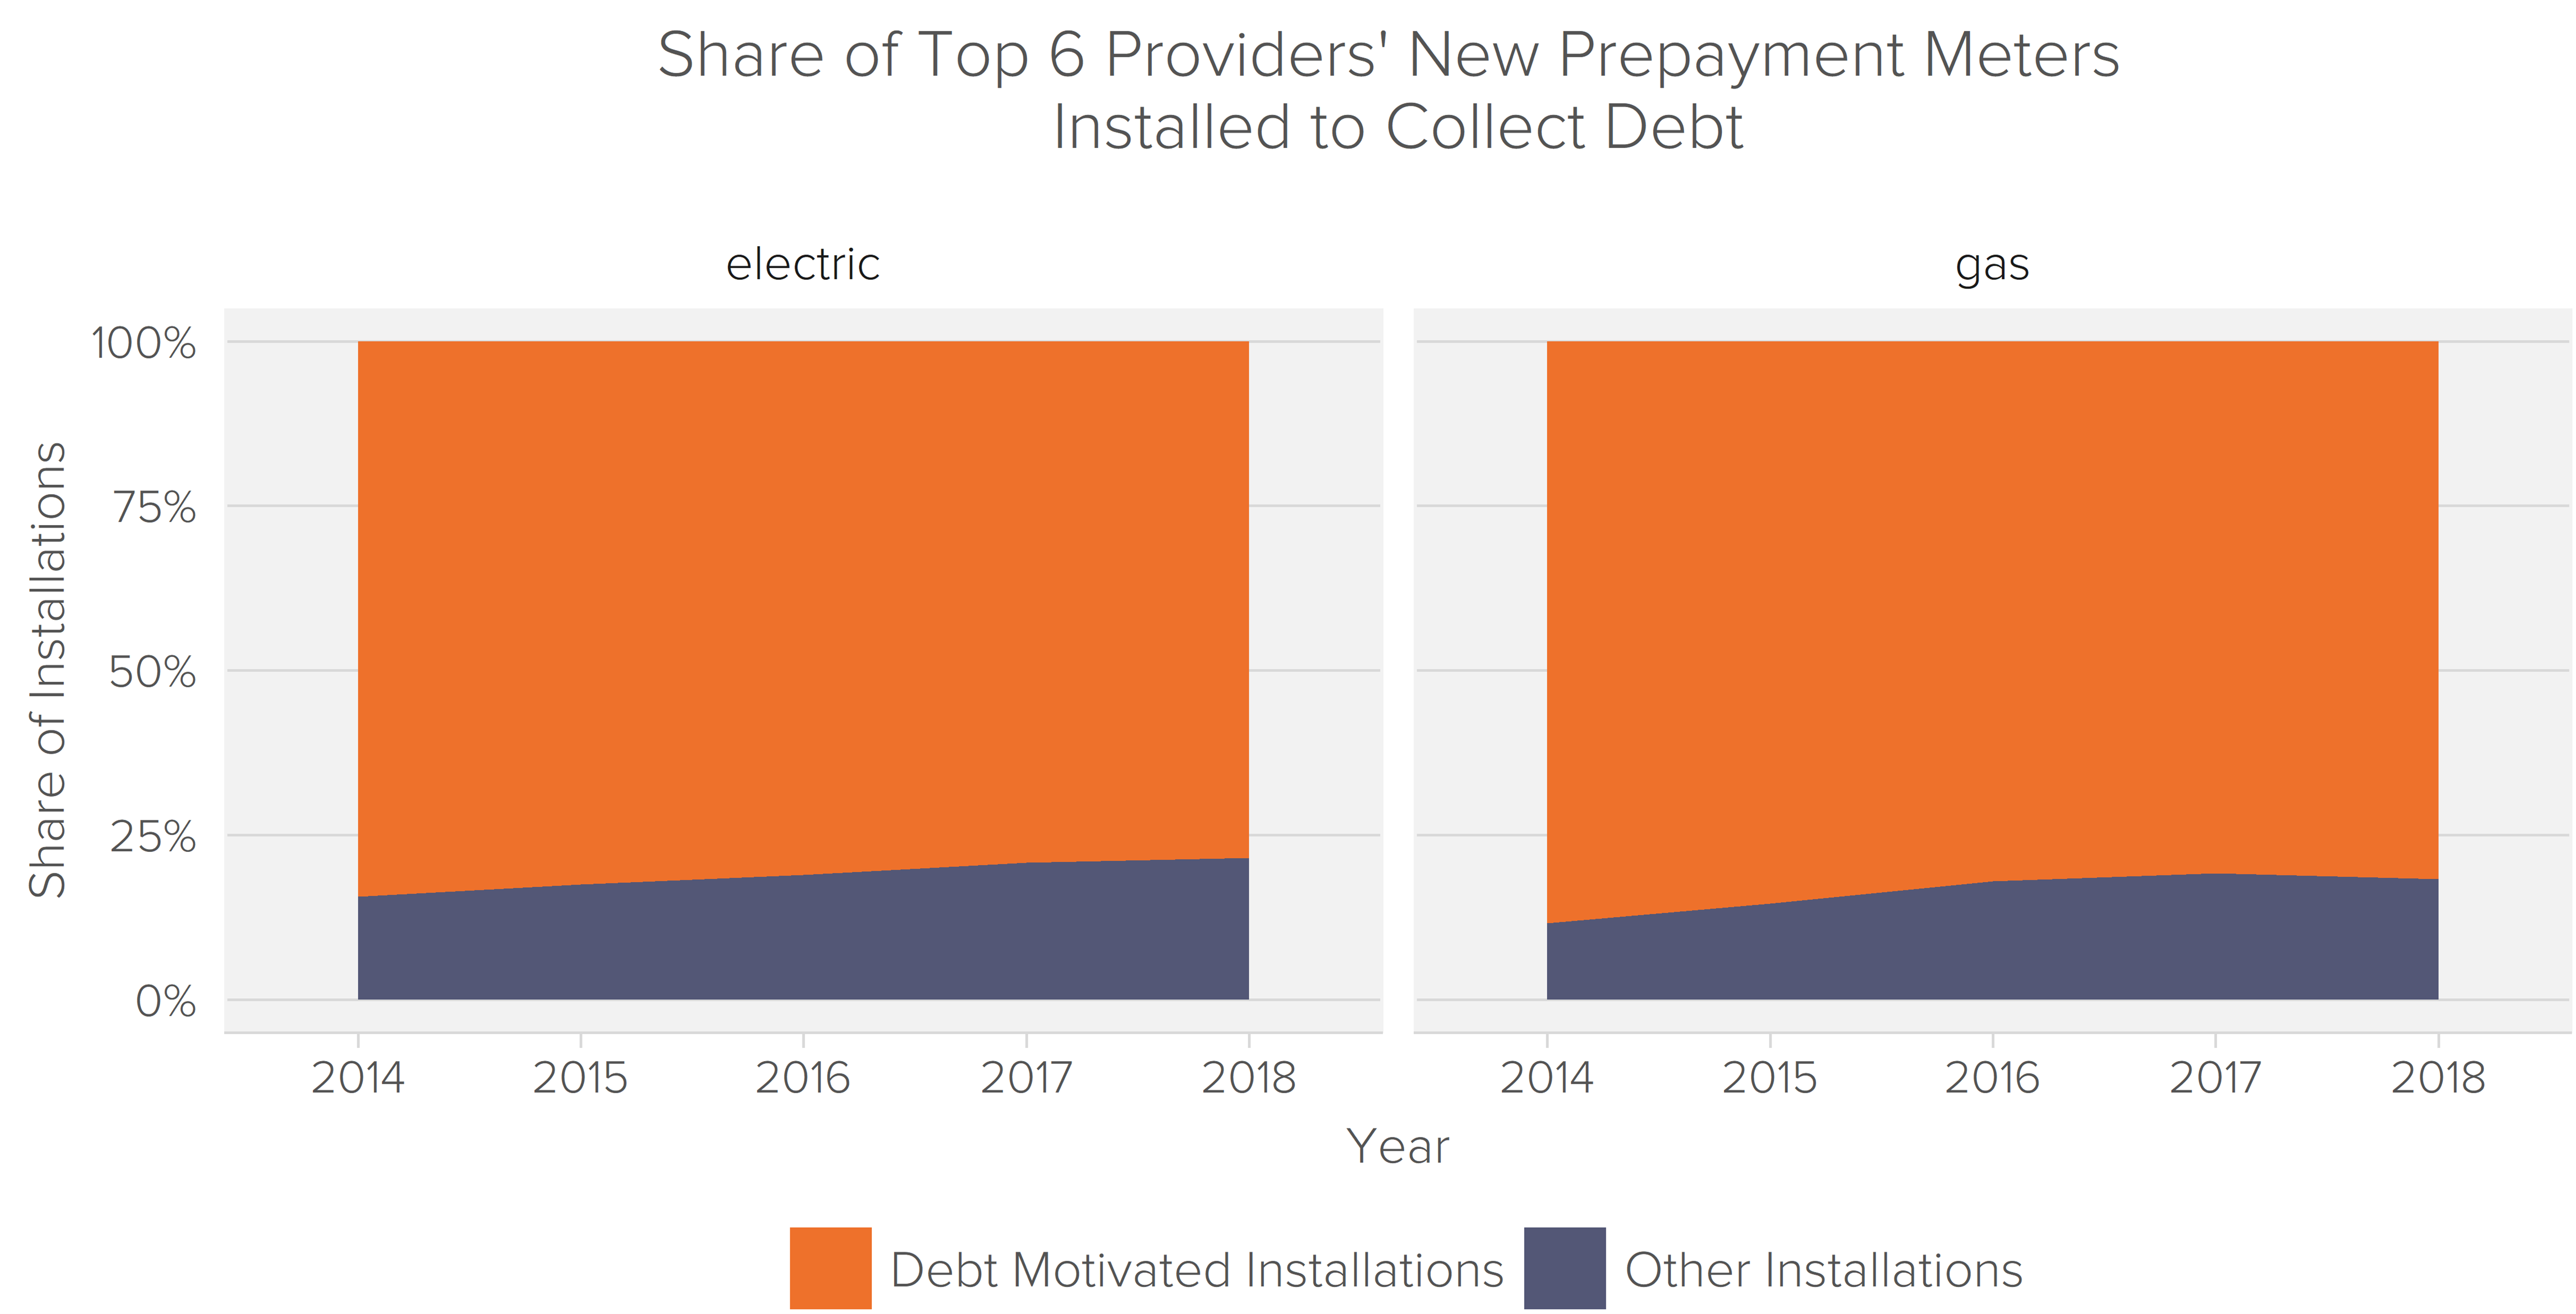
Energy providers must provide Ofgem with “Social Obligation Reporting” data that shows how many PPMs the companies installed each year and how many were to collect a debt. Using this data, we found that consistently more than 75% of new PPMs installed by The Big 6 were installed to collect debt. In other words, these customers had little choice in the matter:
This market structure leads to what the CMA calls “anticompetitive economic characteristics.” Indebted consumers struggle to switch supplier and there is consequently little price competition. PFRC research found that even by switching provider, PPM users still incur expensive premiums and cannot access deals equivalent to those offered to direct debit customers.7 As a result, PPMs are typically more expensive than default tariffs. Indeed, the September 2016 JRF report provides that around 20% of PPM users are in fuel poverty, compared with 7% of direct debit users.8
While the precise mechanism is less clear, there is also an unambiguous connection between social housing and prepayment use. Between 2014 and 2018, nearly 75% of Fuel Poverty Survey respondents using a PPM lived in some form of social housing.
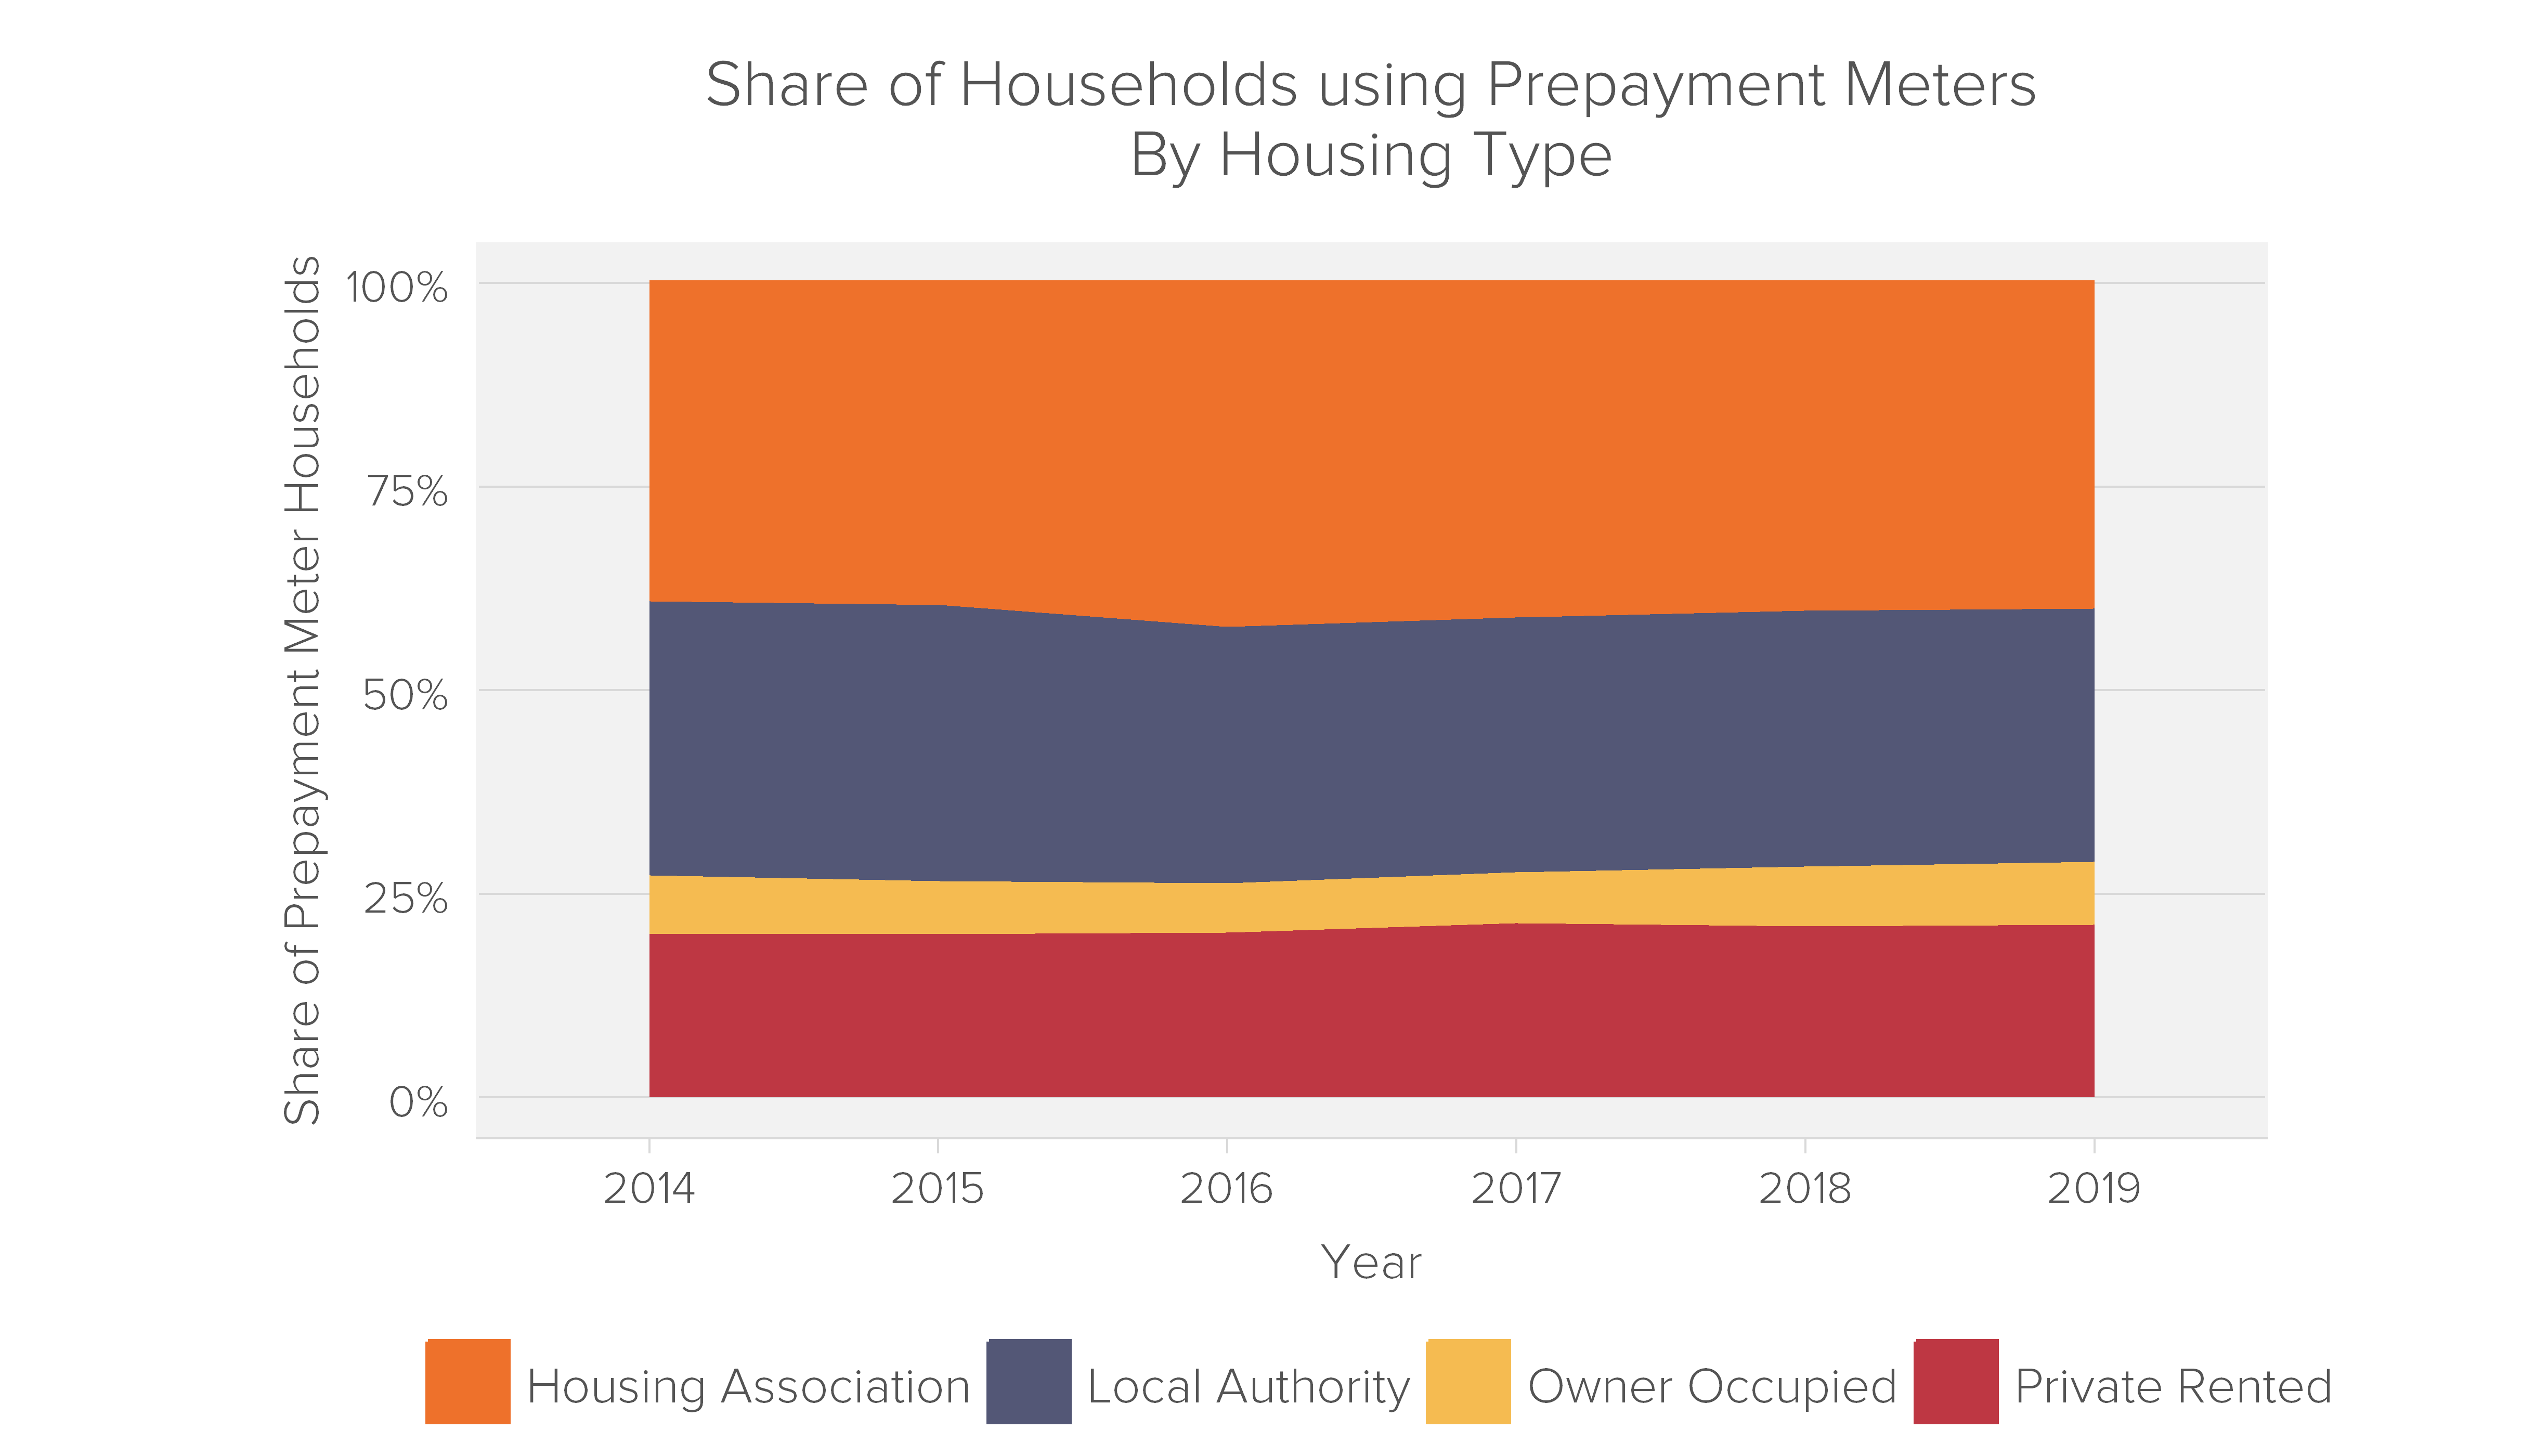
This is mirrored in the literature. The November 2016 PFRC report found that PPM use was most common among those living in social housing.9 Similarly, the 2018 Citizens Advice report found that local authority renters are most likely to have a PPM (43%).10
The market structure and economic vulnerability of prepayment customers results in a substantial poverty premium each year. While customers are often forced onto PPMs due to outstanding debt, there is no default risk once the user is on a PPM. The price difference between a PPM and a normal tariff should therefore only reflect any difference in operating costs. Instead, the CMA found that:
“The range of tariffs available to prepayment customers is significantly more limited than those available in the credit meter segments, and that the cheapest tariffs that are offered by suppliers to prepayment customers are significantly higher (even accounting for differentials in the costs to serve) than the cheapest tariffs in the direct debit segments.”11
This finding led Ofgem to put a price cap on PPMs, which it has repeatedly revised – allowing suppliers to increase prices. Indeed, the tariffs charged by the Big 6 suppliers are usually only a few pounds below the cap. The University of Cambridge Energy Policy Research Group published a paper in October 2018 examining the lowest price PPM tariff offers available on Ofgem-accredited price comparison websites, to determine whether there is competition below the PPM tariff cap. The report found that, “with the exception of one fixed tariff offered by one large supplier, all large and medium suppliers are pricing at the cap. So too are several small suppliers.”12
Prior to the recent energy crisis, the cheapest prepaid tariffs were consistently £100 – £270 more expensive per year than the cheapest direct debit tariffs. Moreover, the difference in tariffs consistently exceeded the difference in caps. That is, prepayment tariffs were consistently set at the Ofgem cap, while direct debit tariffs were frequently below their respective cap.
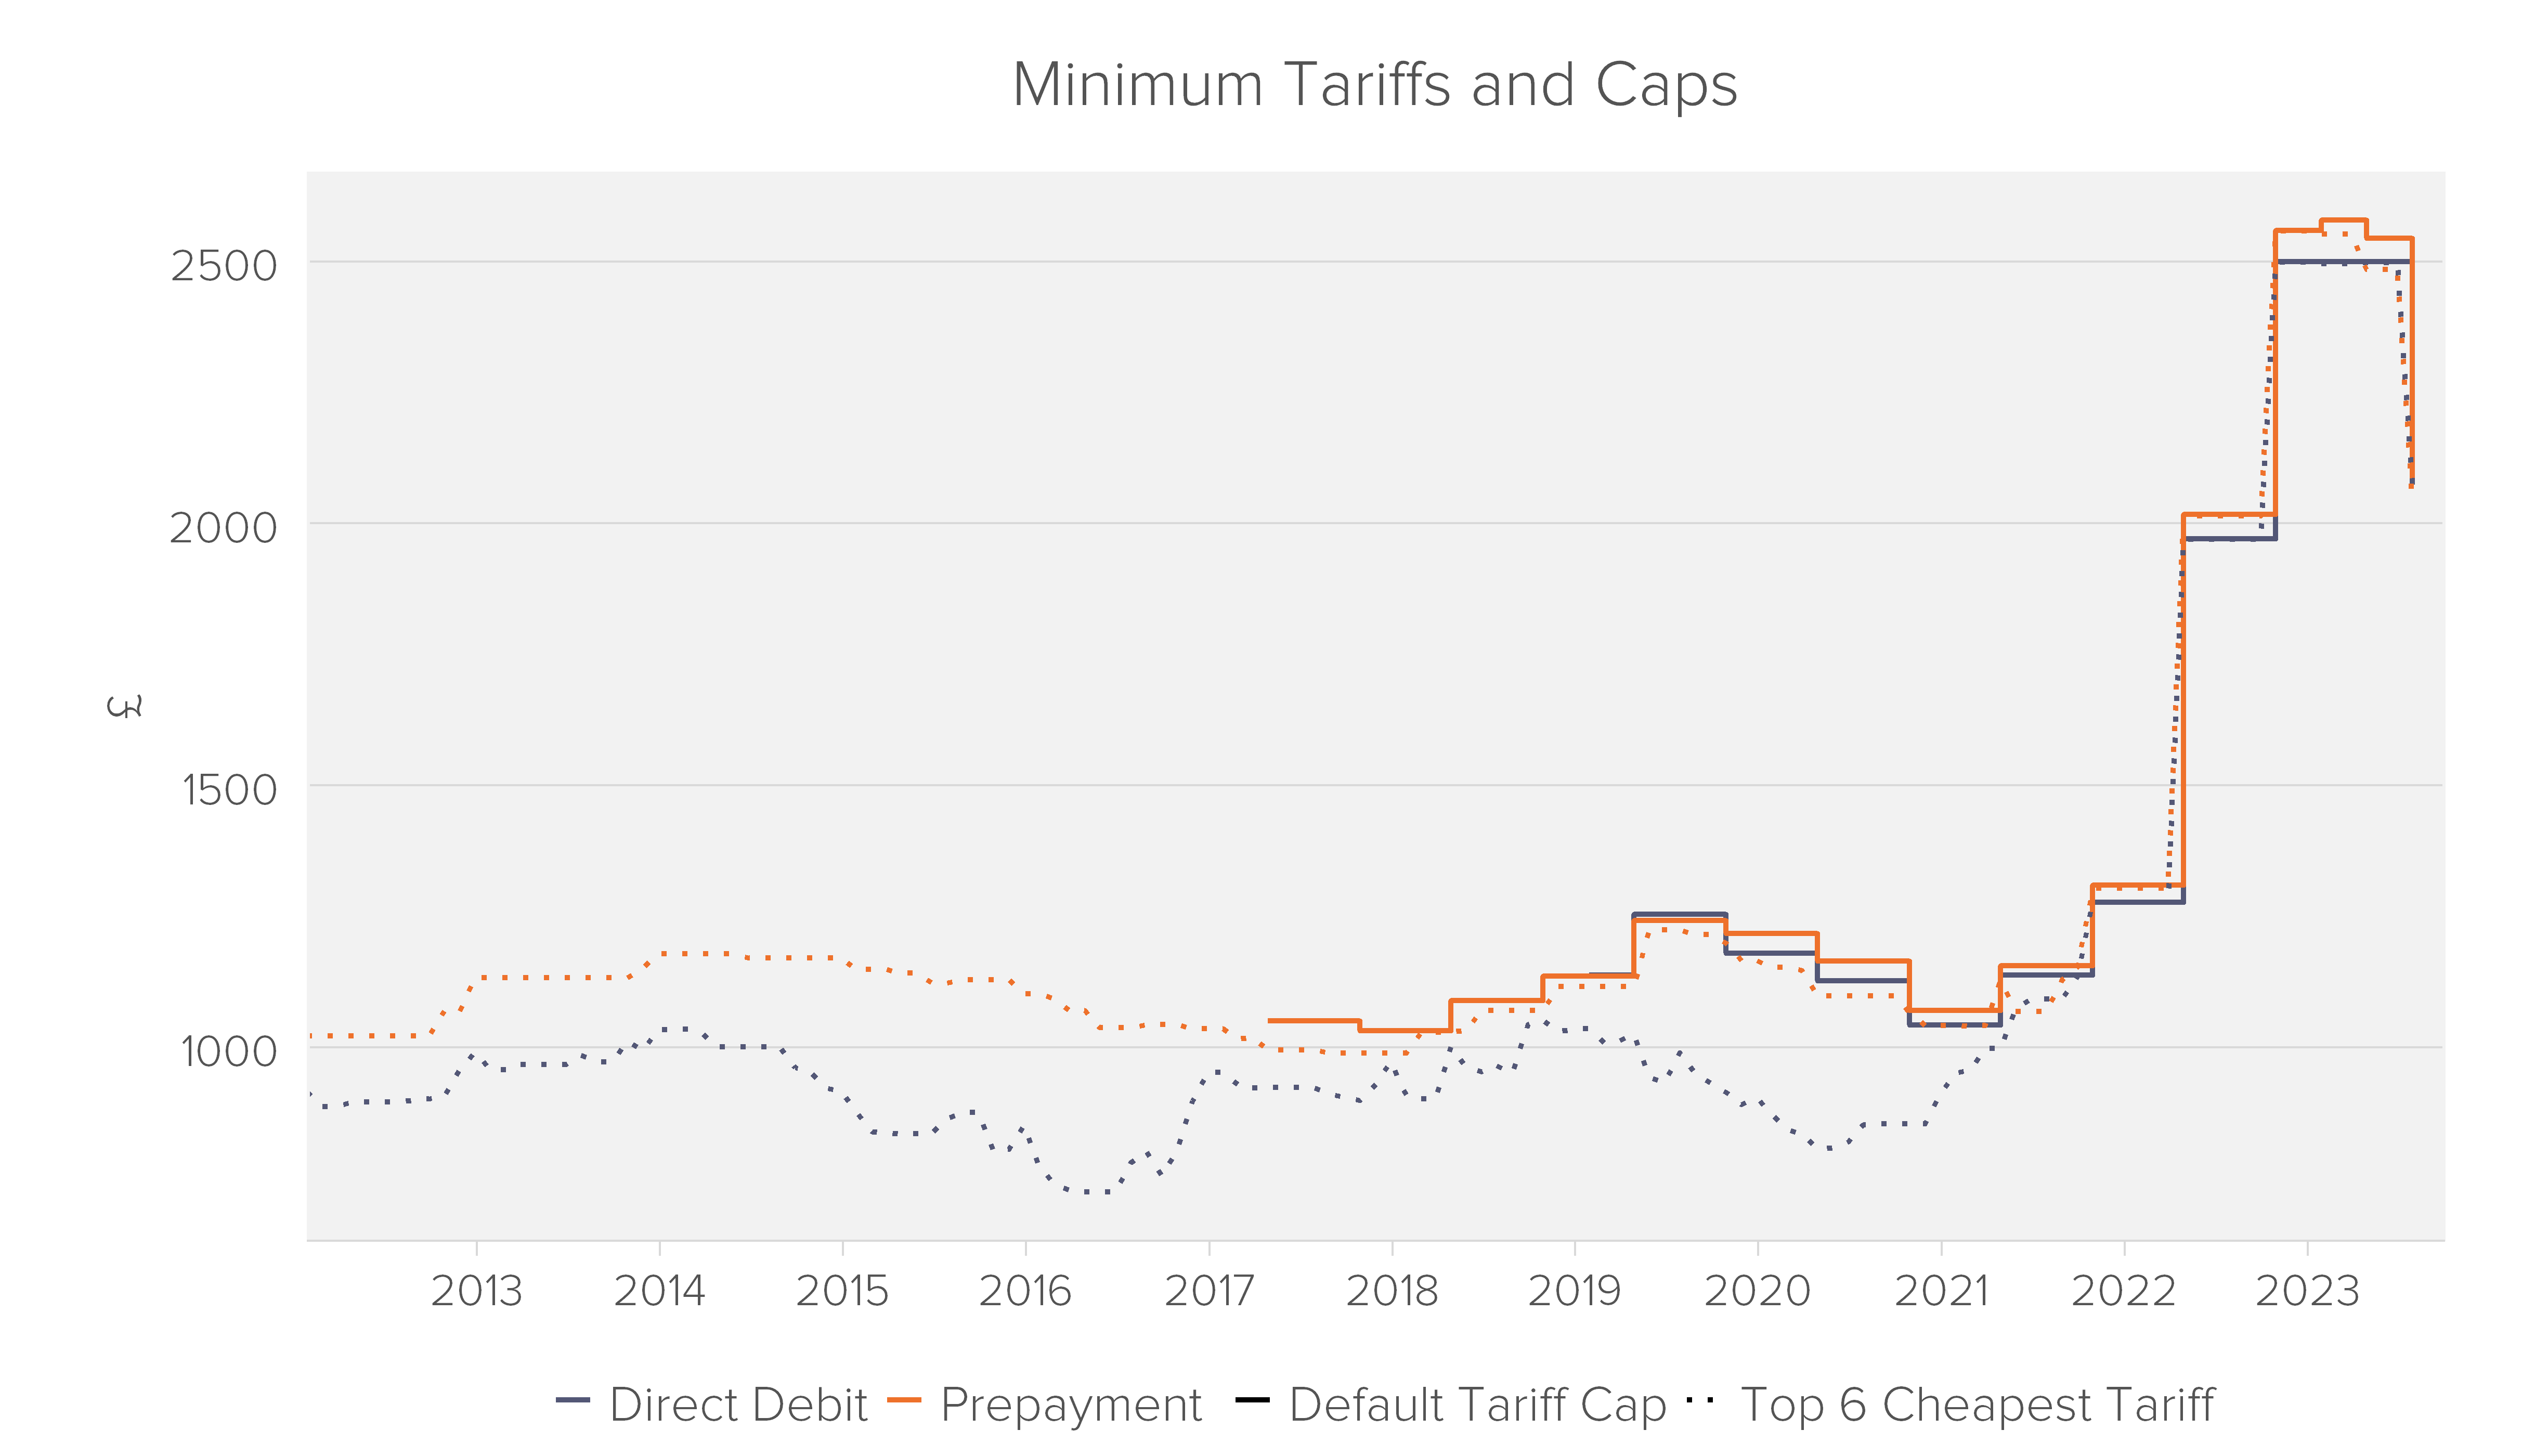
Source: Ofgem/Fideres calculations
The UK’s Equality Act of 2010 shields people with protected characteristics from so-called “indirect discrimination.” This refers to a when a facially neutral policy has a disparate impact on a particular group of the population. In other words, a policy which, at face value, treats everyone the same way actually puts a protected group at a particular disadvantage.13 For example, if an employer applied a minimum height requirement for a job (and height was not truly relevant to job performance), this could constitute indirect discrimination on the basis of sex or race, even though the employer has not technically considered either in its hiring decisions.14
In this case, energy suppliers do not explicitly charge higher tariffs depending on race, sex, or disability, but (as we will proceed to show) the additional cost of PPMs disproportionately falls on people with protected characteristics. That is, the poverty premiums associated with PPM use have a disparate impact on protected groups of the population. Historic PPM tariffs may therefore constitute indirect discrimination in contravention of the Equality Act.
The CMA’s 2016 energy market investigation found that:
“Prepayment customers include higher proportions of individuals with a range of demographic characteristics that we have found to be associated with low levels of engagement in the domestic retail energy markets, and notably: low levels of income; low levels of education; living in social rented housing; and having a disability.”15
In other words, PPMs largely affect economically vulnerable households.
We further analysed the relationship between protected characteristics and PPM use at a household level using the English Housing Survey.16 Not only did this corroborate that ethnic minorities are more likely to use PPMs, it further showed that single mothers and the disabled are abnormally likely to use PPMs.
A larger share of minority households reported using a PPM for at least one of their electric/gas payments than white households. In 2014, 36% of minority respondents used at least one PPM, compared with 28% of white households, and in 2018 this was 29% against 23%. Across all survey data, 26% of households used a PPM for at least one utility (electricity or gas).
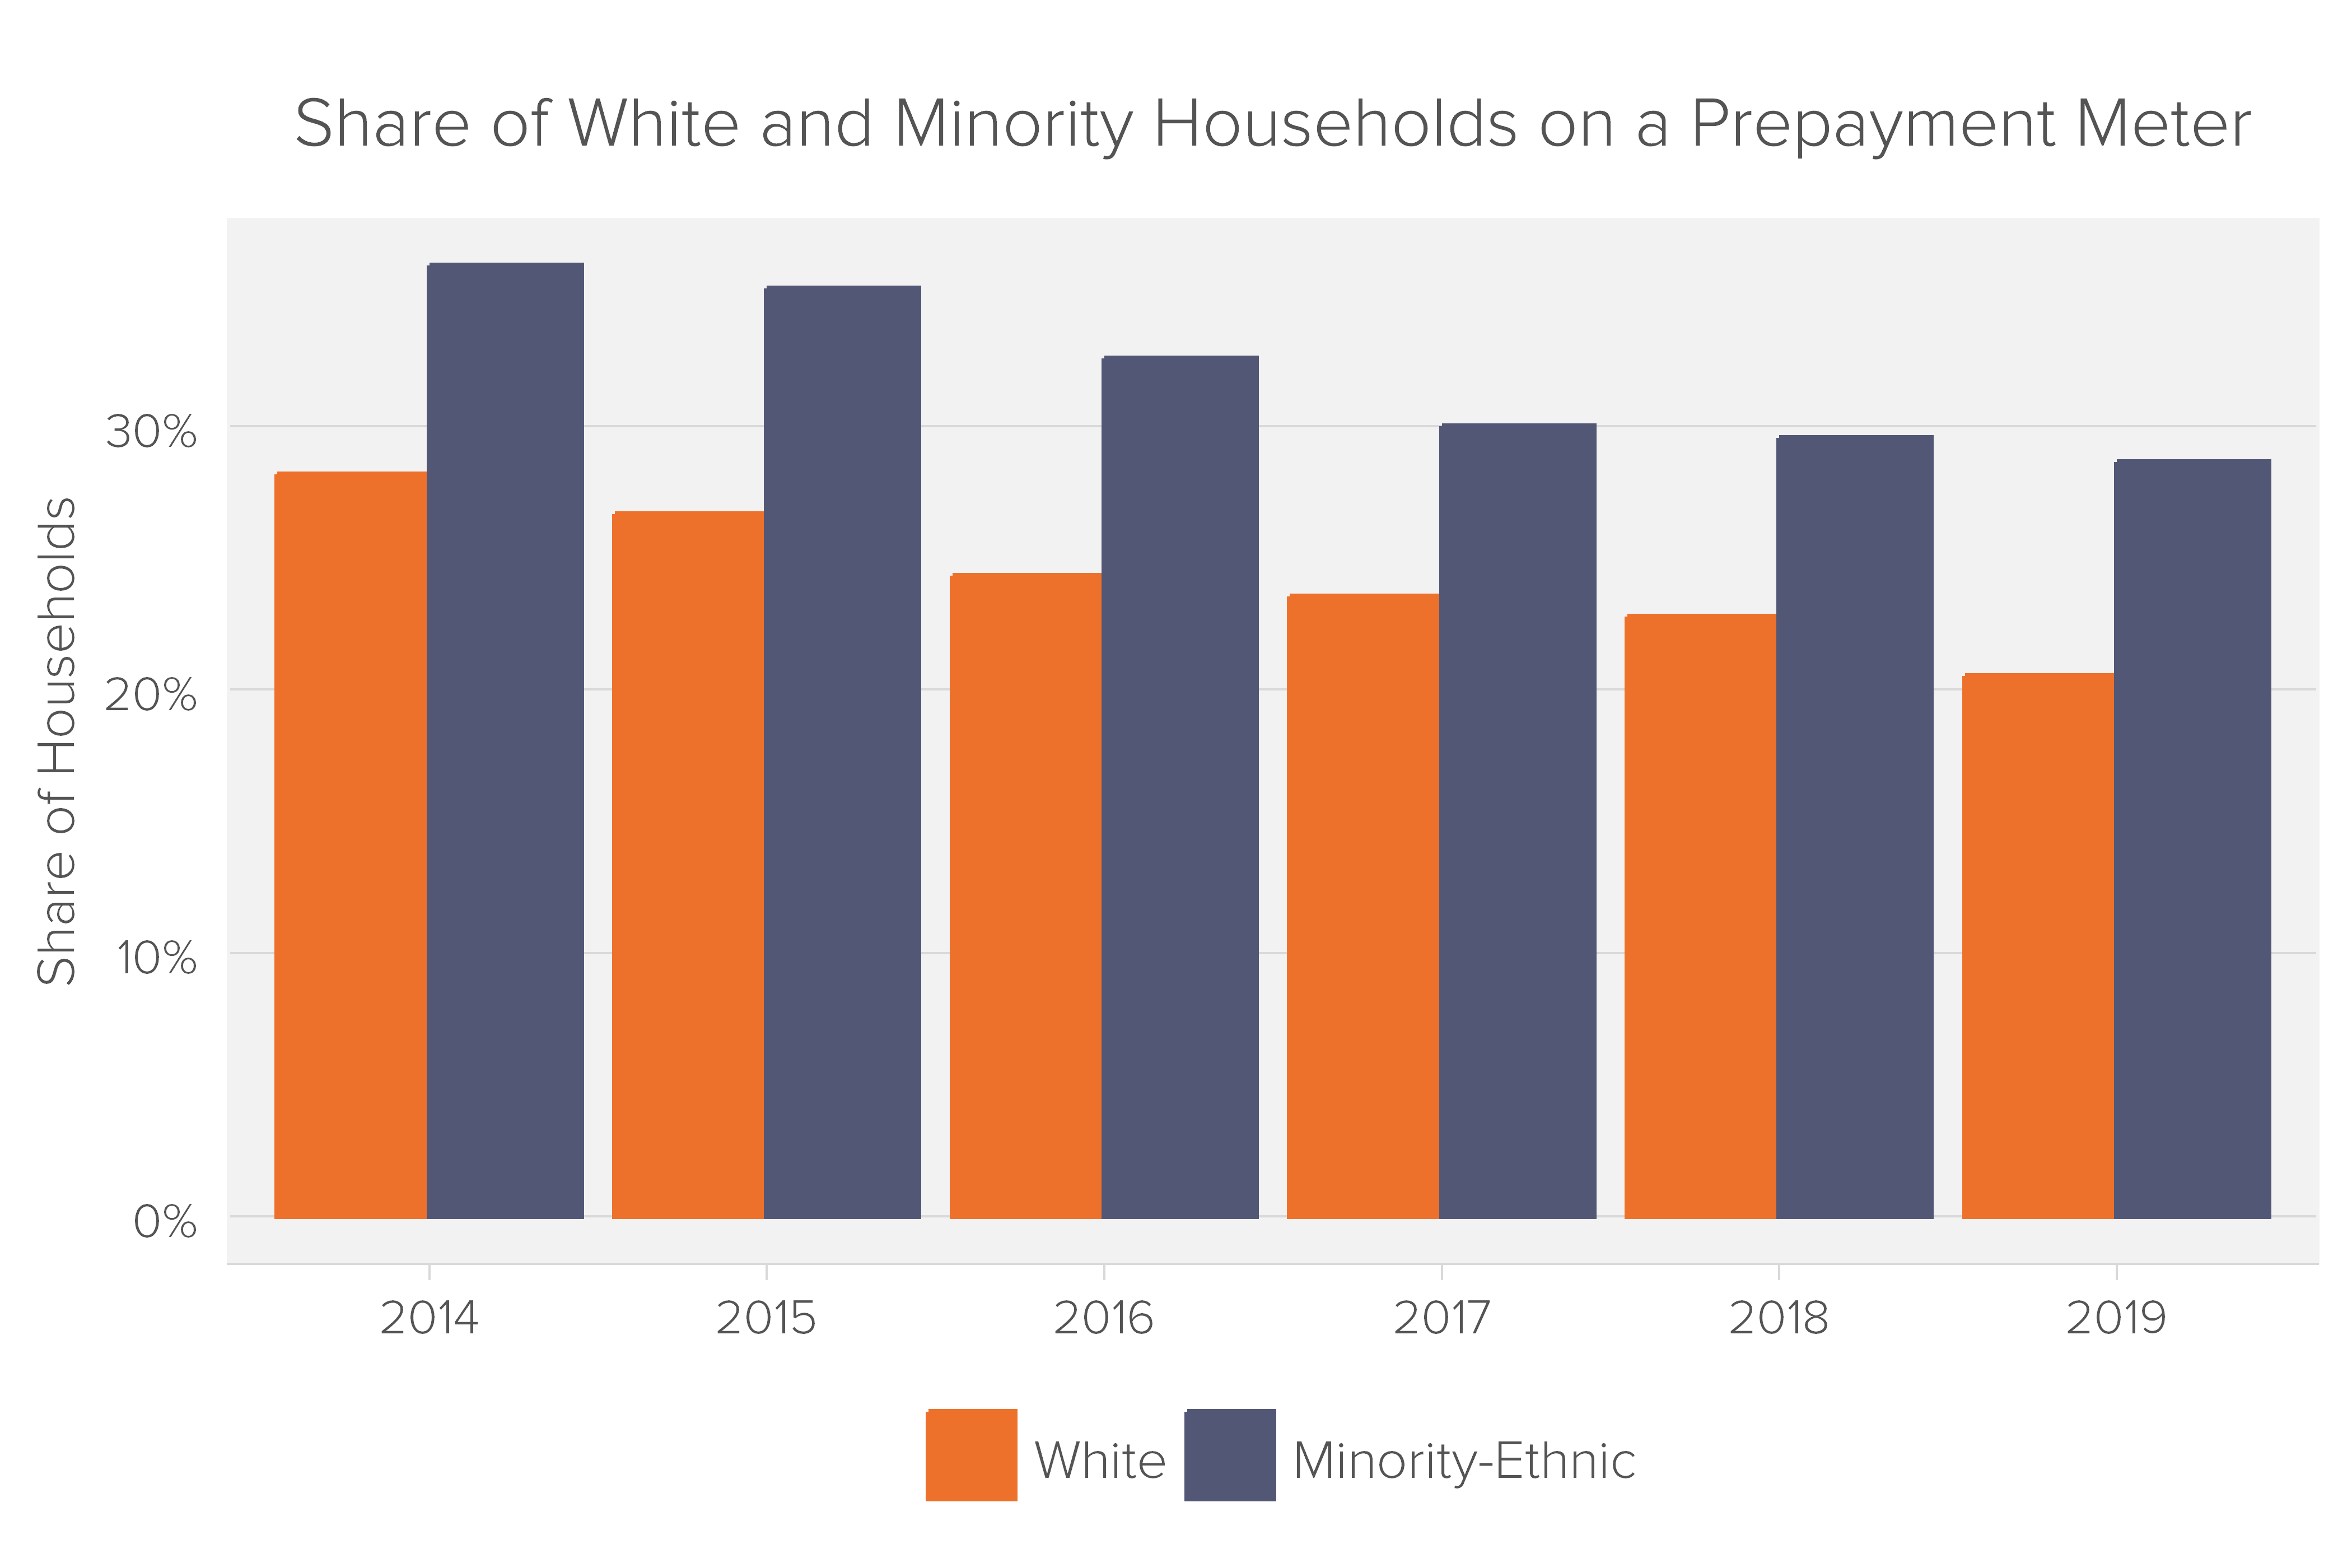
Between 2014 and 2018, a larger share of minority households used at least one PPM compared to white households in every year. As a result, across all income levels, ethnic minorities were more likely than white households to use a PPM.
We used a logit regression model to estimate how much more likely ethnic minorities are to have a PPM while controlling for income. We found that, controlling for income, ethnic minorities were 1.4 times as likely to use a PPM in comparison to white households.
The Fuel Poverty data does not directly show the gender or sex of the respondent, however it does show the composition of the household, including if the respondent is a single parent. We believe this is likely to closely proxy single mothers’ use of PPMs.
Lone parents with dependent children are the most likely household group to use a PPM, with consistently 50-62% of lone parent respondents reporting that they use a PPM, or double the average of 26%.
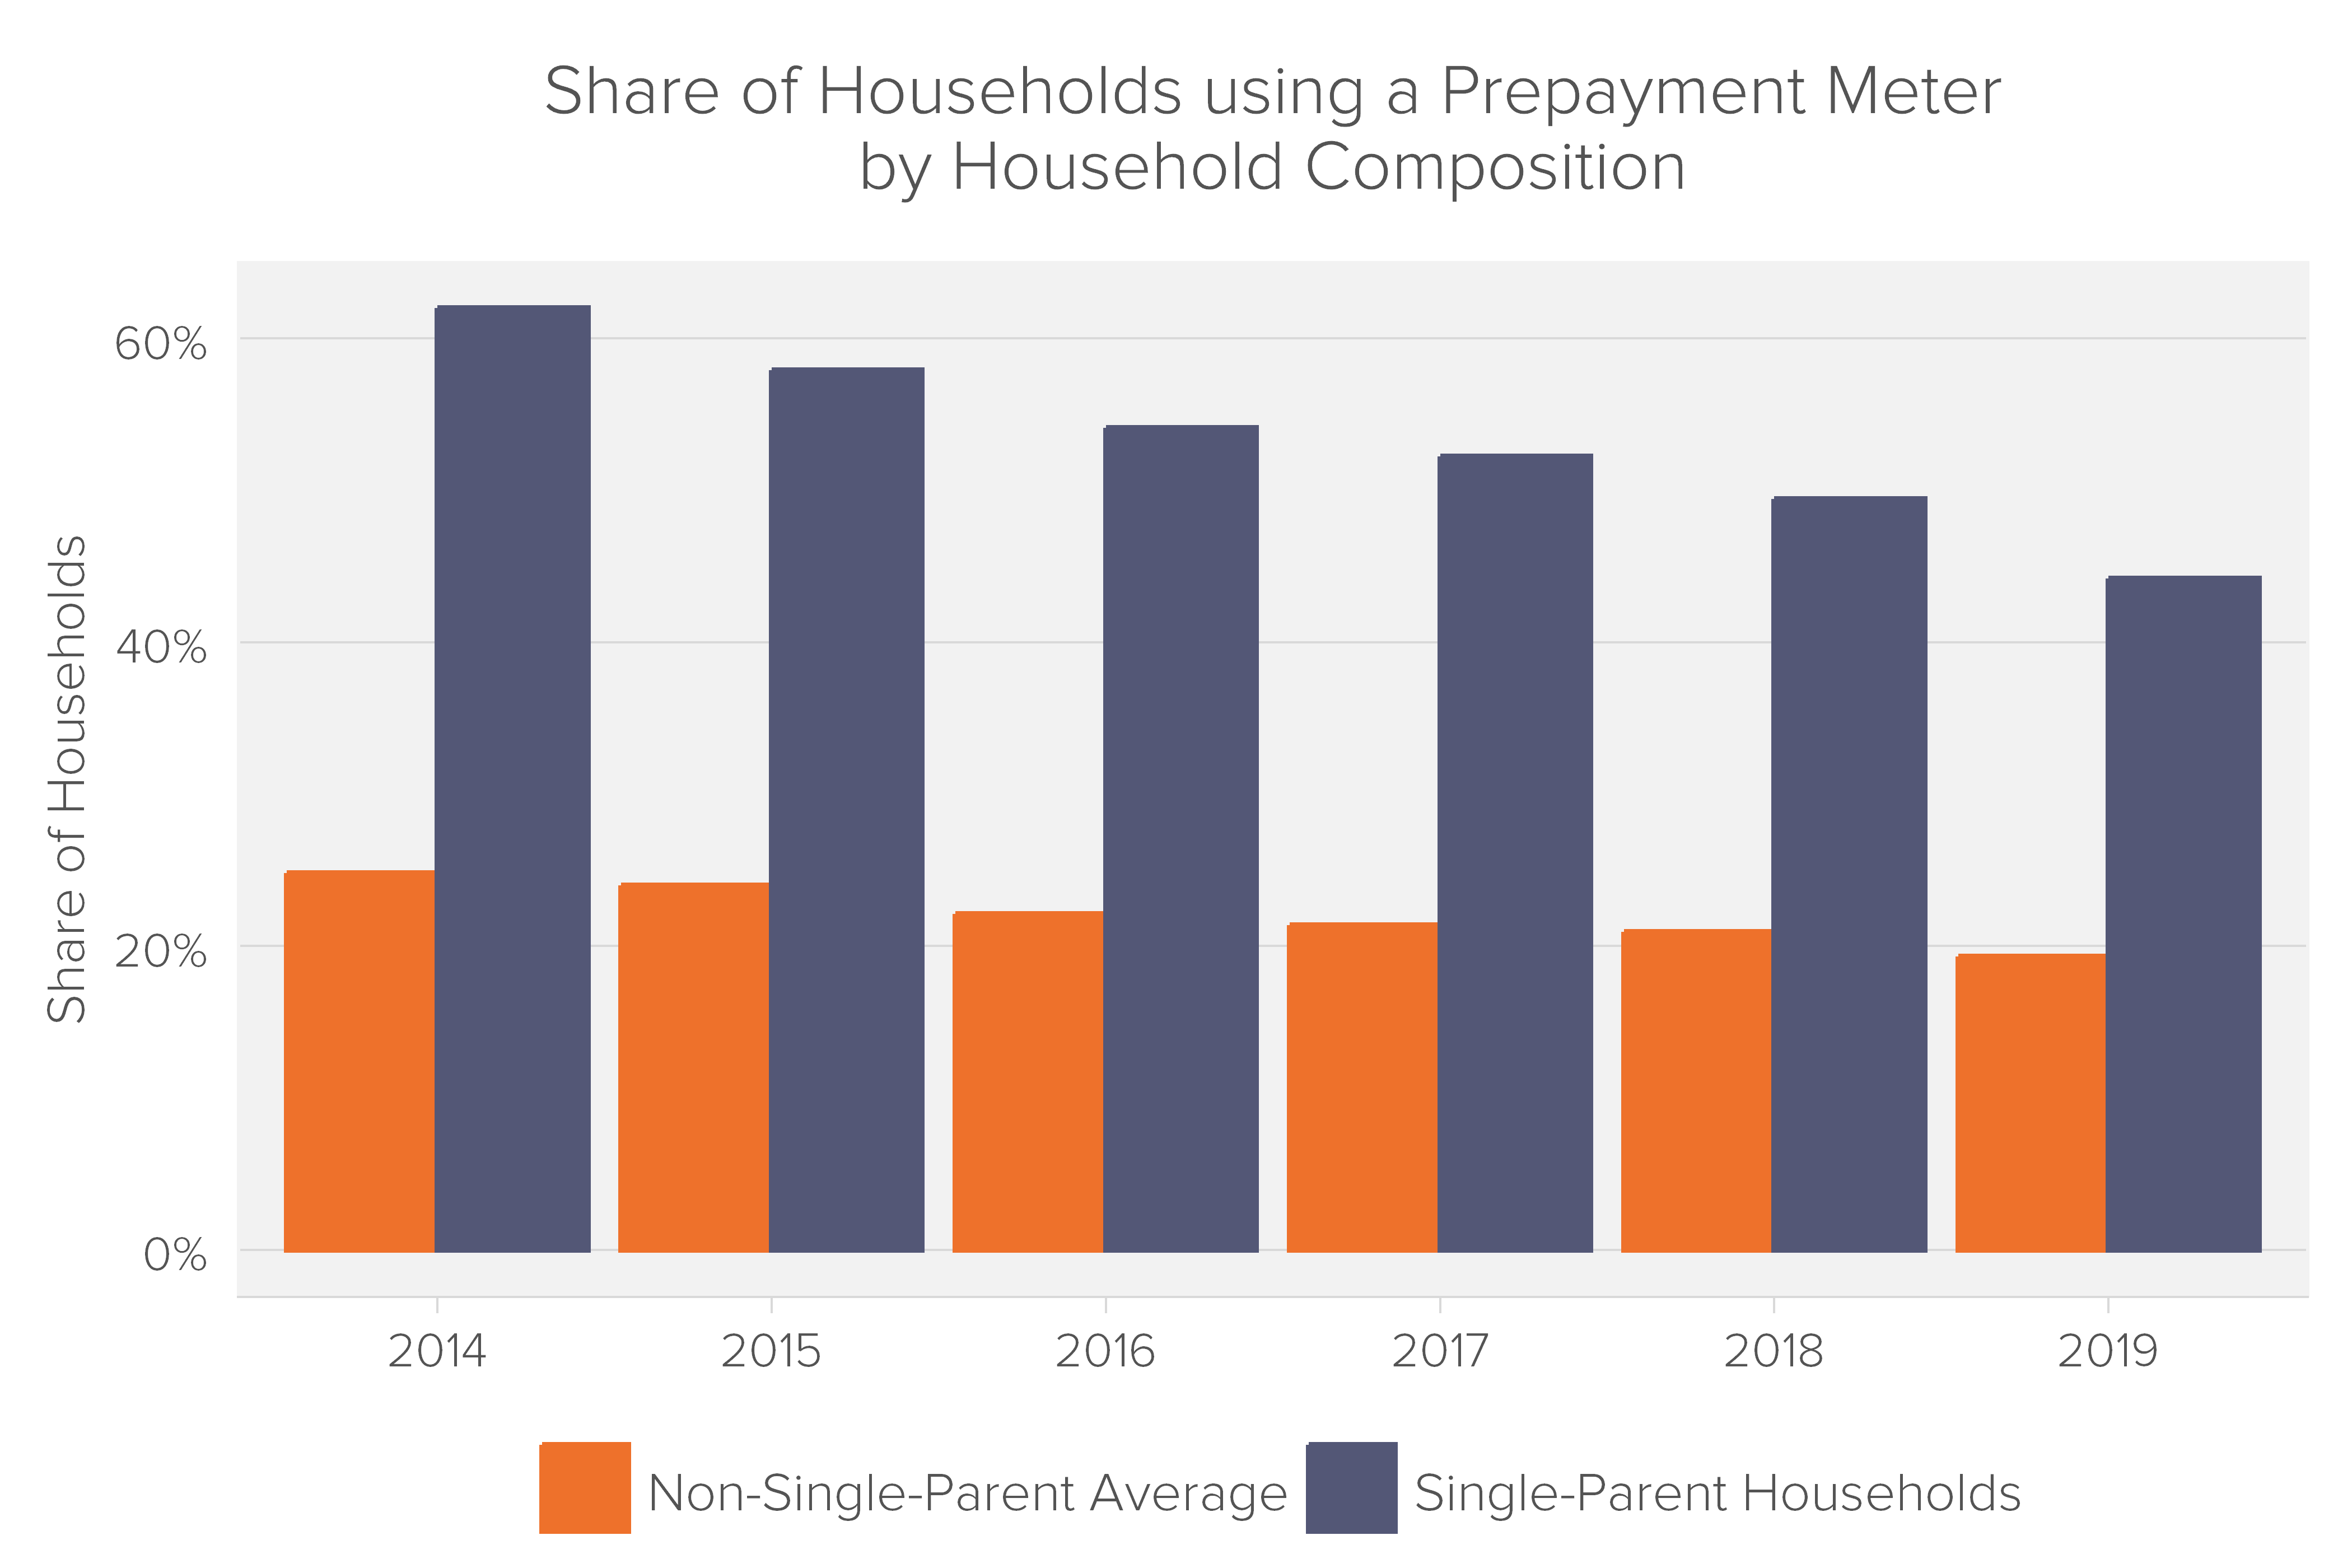
We performed the same logit regression model from our ethnicity analysis on household composition, and similarly found that being a lone parent increased a household’s likelihood of prepayment use 22x.
The PFRC report also found that single parents (typically women) are more likely to pay for energy using a PPM and are vulnerable to paying more through PPM premiums.17 In fact, the report found that single parents were the household type most likely to be in fuel poverty. They further noted that 95% of single parent households are headed by women.18
In their words, lone parents were “significantly more likely to use a PPM,” which resulted in a “considerable premium” in 2016. That year, 61% of lone parent households incurred a PPM electricity premium, which was considerably higher than the average of 32% for all household types. For gas, 54% of lone parent households incurred a premium relating to PPM use, in contrast to the average of 28%.
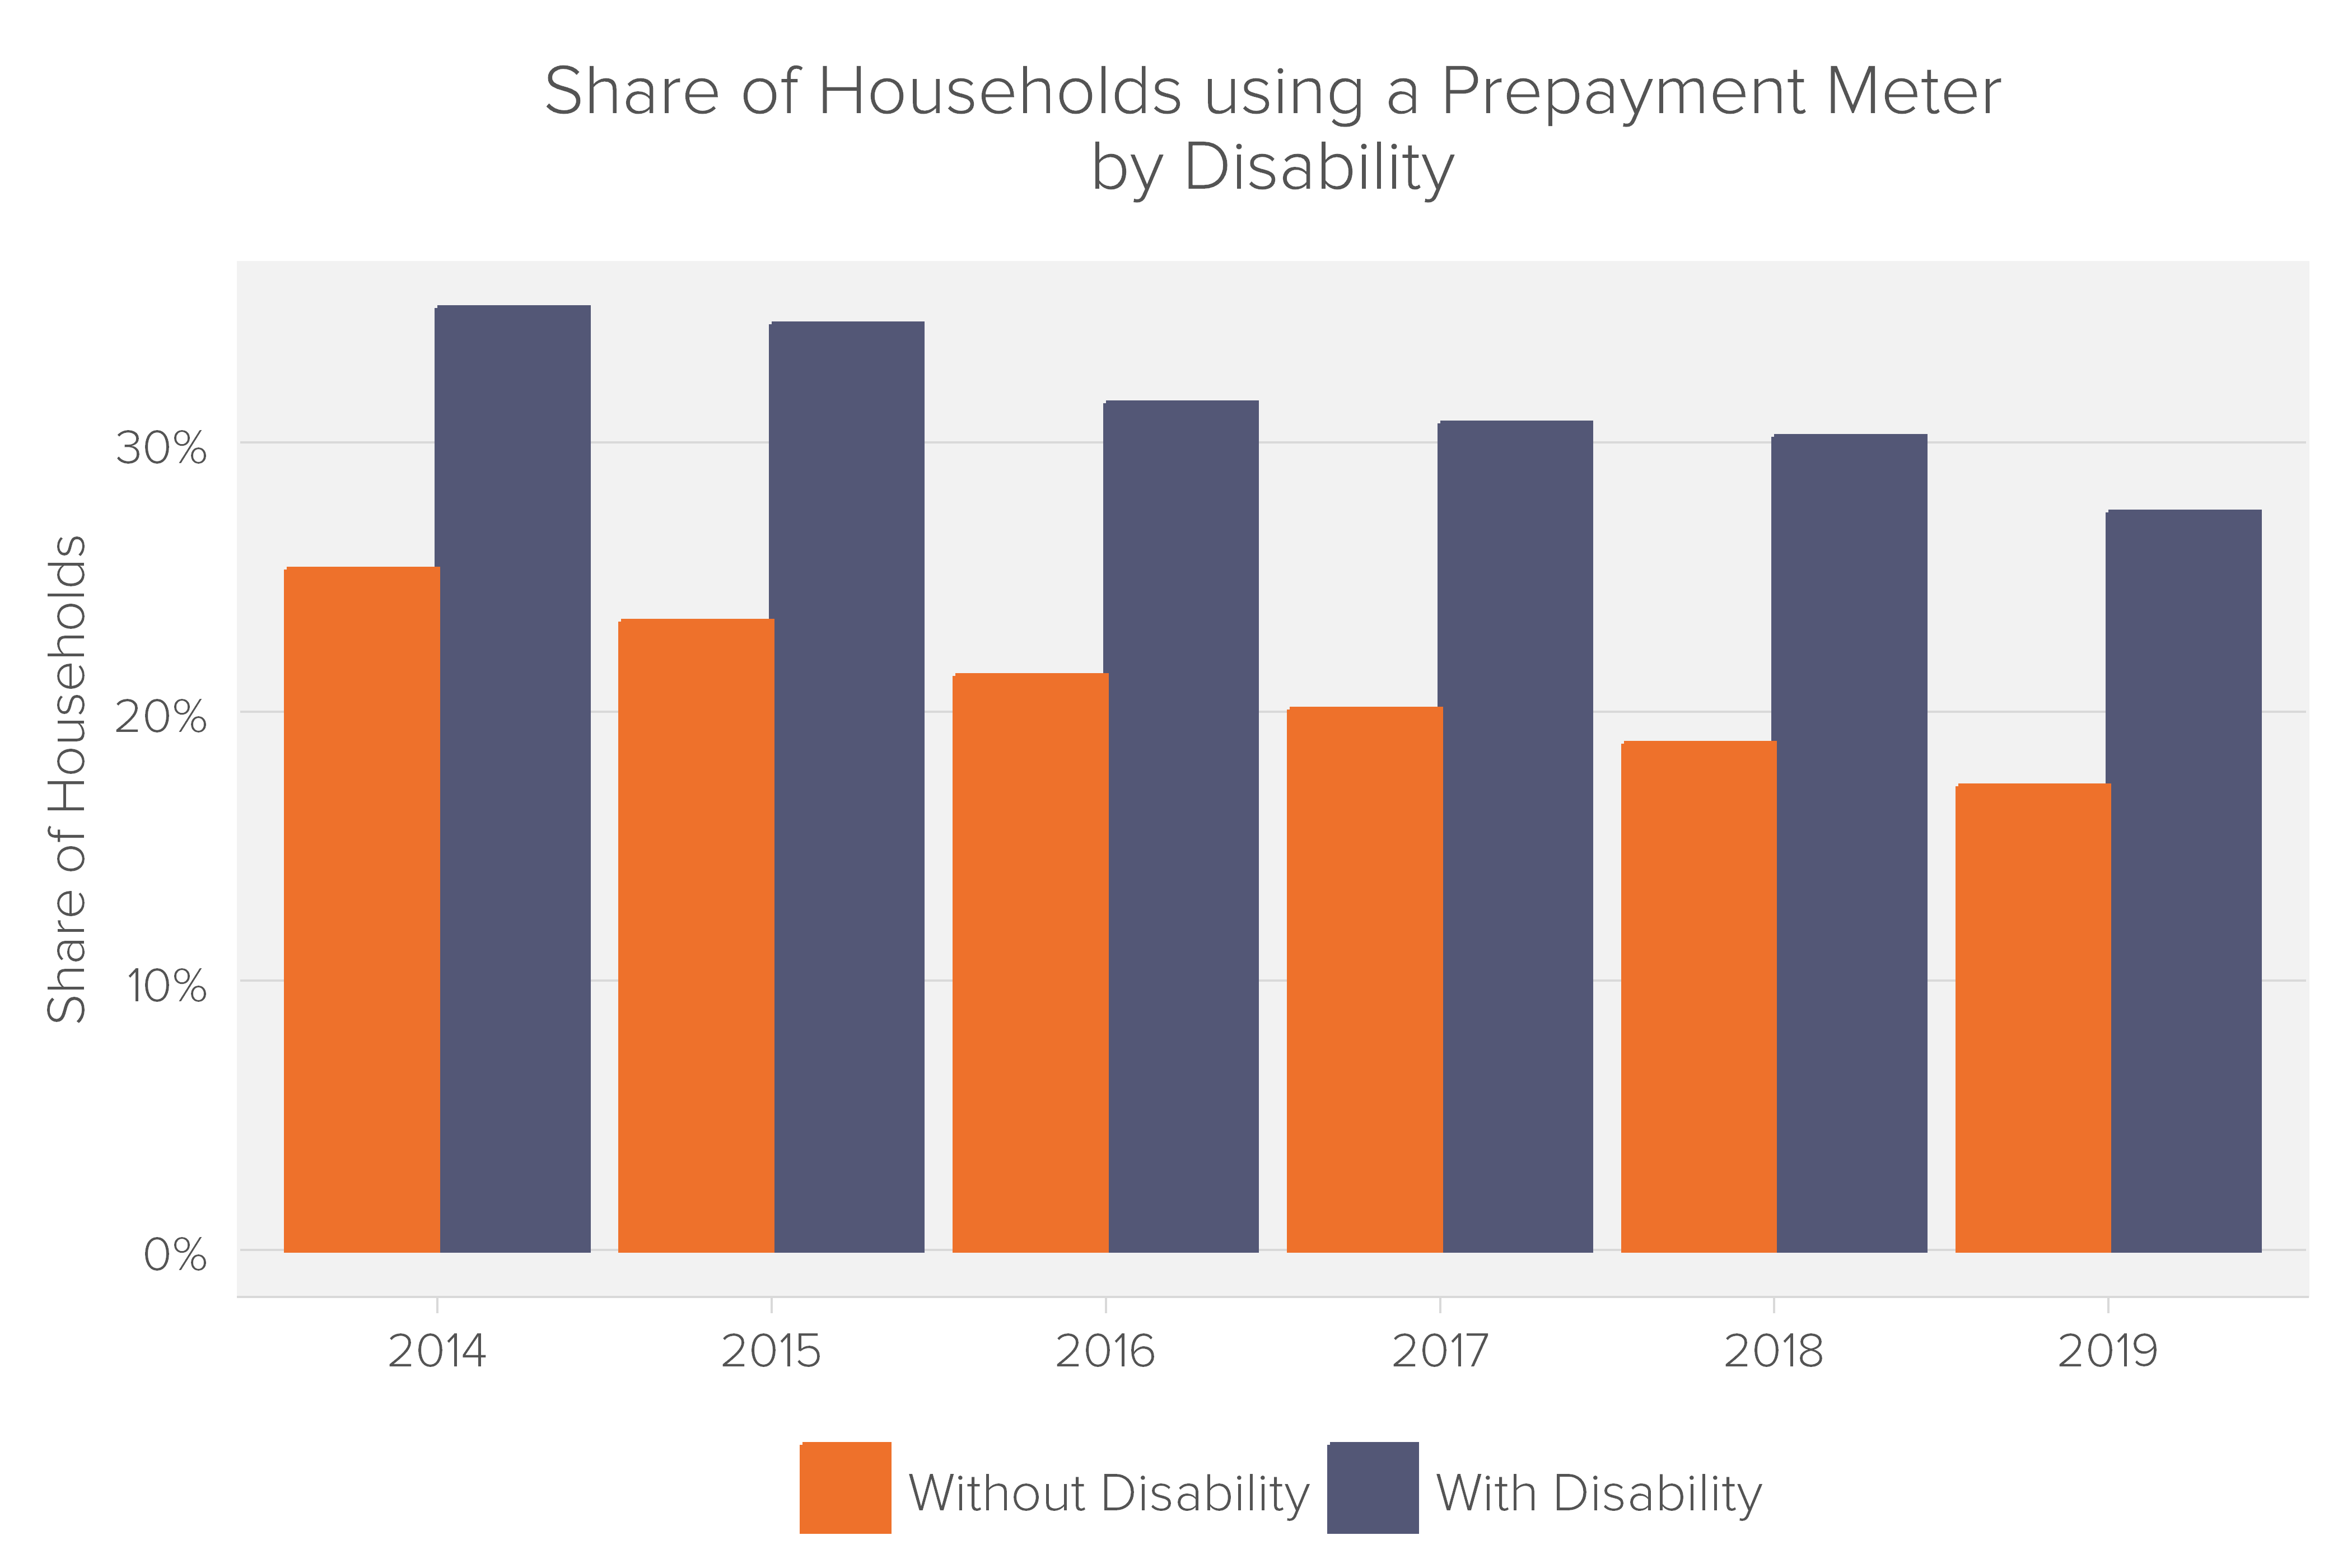
Finally, we analysed the relationship between disability and PPM use in the Fuel Poverty data. We observed a similar relationship between disability and PPM usage, and ethnicity and PPM usage. In 2014, 35% of responding households with at least one member who had a long term illness or disability stated they used a PPM, as opposed to 25% of non-disabled households. In 2018, the gap was 30% to 18%. Throughout 2014-2018, households with a disability were always more likely to use PPMs – shown in the blue columns below (share of disabled households using a PPM) always exceeding the orange columns (share of households with no disability using a PPM):
PPMs are predominantly used by ethnic minorities, single mothers, the disabled, and those living in social housing. These protected groups bear the brunt of the excessive tariffs associated with PPMs.
Indeed, the PFRC agreed, stating:
“The way in which non-standard payment methods contribute to the creation of poverty premiums is already recognised. However, the reanalysis of the survey data finds that this impact is falling hardest on those with certain protected characteristics, even among low income households as a group. In line with the Equality Act, those who provide basic services should aim to demonstrate that there is no inequality arising from the costs incurred by those with protected characteristics.”19
The February 2021 PFRC report noted that individuals with disabilities are more likely to use PPMs and less likely to pay by direct debit. The report found that the percentage of disabled households incurring a PPM premium in 2016 was considerably higher than the average for all household types (for electricity, this was 60%, vs 32%. For gas, this was 55%, vs 28%.)
A 2014 report by the University of York similarly found that for electricity payments, a higher proportion of disabled households use PPMs. Moreover, 41% of disabled households using a PPM to pay for electricity were defined as being fuel poor, compared to 35% for non-disability households.20
Across four million prepayment using households, the £100-£270 annual overcharge per household discussed above in Section 3 becomes £400 million to £1.08 billion in annual overcharge. We estimate approximately 50% of these households are either minority ethnic, single mother, or have a long-term illness/disability – leading to about £200 – £500 million in poverty premiums each year.
Other research takes different approaches to quantifying the PPM surcharge but tends to reach similar conclusions. In 2015, Citizens Advice found that prepay energy customers pay on average £226 a year (22%) more than they would on the cheapest online direct debit deals. The CMA estimated a cost of £500 million to consumers in 2015 related to PPMs.21
However, this spring Ofgem announced that the summer price caps would be equalized between prepayment meters and direct debit. The large suppliers responded by equalizing tariffs in April, in one case setting gas PPM tariffs below direct debit.22 This meant that, for the first sustained period in the past 10 years, prepayment customers would pay the same amount (or less) for energy than direct debit customers – showing that they never should have been more expensive in the first place.
The problem is that, as we recover from the current energy crisis, we expect the same old problem to re-emerge – prepayment customers will be stuck paying the cap (even if the same cap applies to both direct debit and prepayment), while direct debit customers enjoy a range of competition and therefore tariffs below the cap.
This is already happening too – on November 23rd, Ofgem announced that the new price caps taking effect on January 1, 2024, would once again put prepayment prices above direct debit.23
[1] https://www.comparethemarket.com/energy/content/prepaid-meters-vs-direct-debit/.
[2] https://www.nomisweb.co.uk/census/2011/dc1201ew
[3] https://assets.publishing.service.gov.uk/government/uploads/system/uploads/attachment_data/file/789331/MSOA-prepayment-electricity-2017.csv/preview
[4] https://www.bristol.ac.uk/media-library/sites/geography/pfrc/pfrc1615-poverty-premium-report.pdf (hereinafter, “Paying to be poor”), pp. 27-29, 35. This report was based on a survey of almost 1,000 low-income households undertaken in Spring 2016, in addition to seven focus groups that were held across four locations (Glasgow, Telford, London and Bideford) and three age groups (18-25, 26-55, 65 plus).
[5] https://www.jrf.org.uk/blog/acting-unfair-poverty-premiums-must-be-2017-priority
[6] https://bynder.capuk.org/m/3c97235f6d255a45/original/A-dark-place.pdf?_gl=1*1e3fh7s*_ga*MjU5OTk1MjU0LjE3MDIzMDEyNTA.*_ga_JDHF1MTESF*MTcwMjMwMTI1MC4xLjEuMTcwMjMwMTI1NC41Ni4wLjA.*_gcl_au*NzE0MzUyODExLjE3MDIzMDEyNTA. The report was based on a survey of 1,008 respondents and five focus groups with Christians Against Poverty clients held in Bolton, Southampton and Inverness.
[7] Paying to be poor, p. 54.
[8] https://www.jrf.org.uk/report/uk-poverty-causes-costs-and-solutions pp. 44.
[9] Paying to be poor, pp. 5-6.
[10] https://www.citizensadvice.org.uk/Global/CitizensAdvice/Energy/PPM%20self-disconnection%20short%20report.pdf
[11] Ibid.
[12] https://www.eprg.group.cam.ac.uk/wp-content/uploads/2018/10/S.-Littlechild_16-Oct-2018.pdf. .
[13] https://www.citizensadvice.org.uk/law-and-courts/discrimination/check-what-type-of-discrimination-youve-experienced/indirect-discrimination/#:~:text=Indirect%20discrimination%20is%20when%20there’s,you%20at%20a%20particular%20disadvantage.
[14] https://www.equality.admin.cam.ac.uk/training/equalities-law/key-principles/indirect-discrimination#:~:text=An%20example%20of%20indirect%20discrimination,are%20generally%20shorter%20than%20men.
[15] https://assets.publishing.service.gov.uk/media/576c23e4ed915d622c000087/Energy-final-report-summary.pdf
[16] As part of the English Housing Survey, the government publishes an annual `Fuel Poverty Dataset`. The Fuel Poverty data shows the characteristics of roughly 12k households each year.
[17] The-Inequality-of-Poverty-Full-Report.pdf (fairbydesign.com) (hereinafter, “The inequality of poverty”), pp. 6, 44.
[18] The inequality of poverty, pp. 4, 18, 22.
[19] The inequality of poverty, p. 8.
[20] https://www.york.ac.uk/media/chp/documents/2014/Annex%20B.pdf pp. 31-33. The report analysed 2010 to 2011 English Housing Survey data, which was collected via an initial interview survey of approximately 17,000 households, followed by a physical inspection of a sub-sample of approximately 8,000 dwellings.
[21] https://www.jrf.org.uk/report/uk-poverty-causes-costs-and-solutions p. 55.
[22] https://www.moneysavingexpert.com/news/2023/03/british-gas-prepay-price-cut/.
[23] https://www.ofgem.gov.uk/sites/default/files/2023-11/Default%20Tariff%20Cap%20Letter%20for%201%20January%202024.pdf.
Paul joined Fideres after completing a BSc in Economic History at the London School of Economics and Political Science. At LSE, Paul was a Trustee of the Student Union and President of the Music Society, having previously performed with two national choirs in the US. At Fideres, Paul leads our discrimination practice, analysing cases of algorithmic and indirect discrimination, in addition to his work in the Competition team, where he is a project manager. On the Competition team, Paul’s work spans financial markets, with his research on bond market manipulation published by the ABA, digital markets, and industrial organisation.

Could highly concentrated holdings lead to anticompetitive behavior?


How forced bank bail-outs in early 2023 have resulted in fantastic gains for the acquirers.


How Reddit abuses of its monopoly power to fuel vertical expansion.


London: +44 20 3397 5160
New York: +1 646 992 8510
Rome: +39 06 8587 0405
Frankfurt: +49 61 7491 63000
Johannesburg: +27 11 568 9611
Madrid: +34 919 494 330